


Разум растений… и пиво!
Это (не очень) тщательно охраняемый секрет, что у нас в Sure Controls есть самодельный пивной автомат. Пивная машина всегда является изюминкой любого тура по объекту, который мы проводим для наших клиентов. Я подумал, что это также может быть очень классным способом продемонстрировать некоторые из наших возможностей Plant Intelligence! Несколько недель назад наш местный пивовар Джош сварил пару партий. Пока он варил пиво, мы подключили наш внутренний Historian, который мы используем для внутреннего тестирования проектов клиентов, и использовали его для сбора данных. В этой статье я надеюсь продемонстрировать, как мы можем подключиться к процессу для передачи данных, а затем, когда данные будут собраны, какие методы мы можем использовать для просмотра данных.
Часть 1. Сбор данных
В моем предыдущем блоге «Демистификация сбора данных» я подробно обсуждал стандарты и протоколы. Я не буду вдаваться в подробности, но это упражнение — хороший пример того, как мы подходим к проектам, которые выполняем для наших клиентов. Сначала я встретился с Джошем, нашим пивоваром, чтобы определить, какую информацию нам необходимо собрать. По сути, процесс пивоварения состоит из трех этапов:затирание, кипячение и разбивание. Важнейшим элементом, который необходимо контролировать на этих этапах, является температура. Нам также нужен был способ сообщить нашей системе сбора данных, на каком этапе процесса мы находимся.
Для сбора данных о температуре мы проанализировали пивную машину и отметили, что к нагревателям посуды для приготовления пищи подключены терморегуляторы. используется в процессе. К счастью, эти контроллеры имеют коммуникационные возможности, поэтому оставалось только определить необходимый стандарт и протоколы. Эти конкретные элементы управления используют Modbus в качестве протокола связи. Это здорово, так как Modbus очень распространен и с ним легко общаться. Одна проблема, с которой мы столкнулись, заключалась в том, что сами контроллеры использовали для связи только последовательное соединение, а наш сервер Historian находился на некотором расстоянии. Чтобы решить эту проблему, мы использовали последовательное устройство шлюза TCP/IP. Это позволило нашему серверу Historian использовать Modbus TCP для прямой связи с элементами управления и сбора необходимых данных о температуре. Затем нужно решить вопрос об этапах процесса.
Чтобы определить, на каком этапе процесса мы находимся, мы решили использовать небольшой ПЛК и ЧМИ. К счастью, у нас был небольшой ПЛК, который мы использовали для тестирования приложений, и ЧМИ, который мы использовали для демонстрации продаж. Мы запрограммировали ПЛК с помощью регистра, содержащего текстовые данные. We then programmed the HMI with some simple buttons for our brew master Josh to select which step of the brewing process he was in. By pressing the “Mash” button for example, the HMI would then write the value “Mash” into the register programmed in the PLC. The PLC was connected to the Ethernet network, and Historian could then read the register directly logging the process step. This will aid later when viewing the data, in order to give it context.
Part 2 – We have data – now what?
Once the batch of beer was brewed, we used the process steps logged by the PLC as our flags for pulling the data. By noting when the process steps change, we could capture the start and end points for each step of the process. We then brought up each step of the process in a trend view:
The Mash
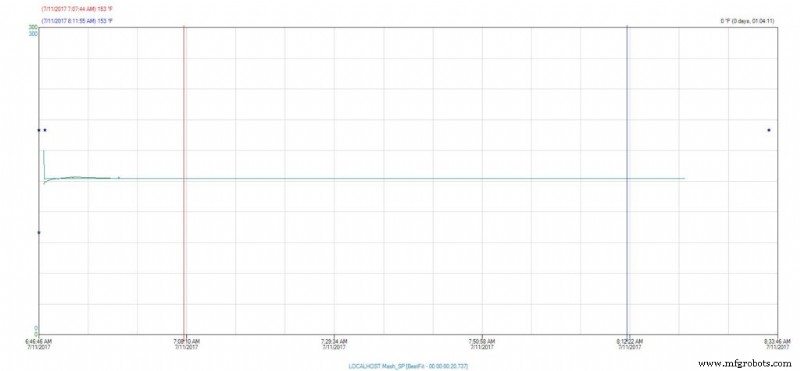
Here we can see that during the Mash phase of the brewing process, our temperature maintained a steady 153° Fahrenheit.
The Boil
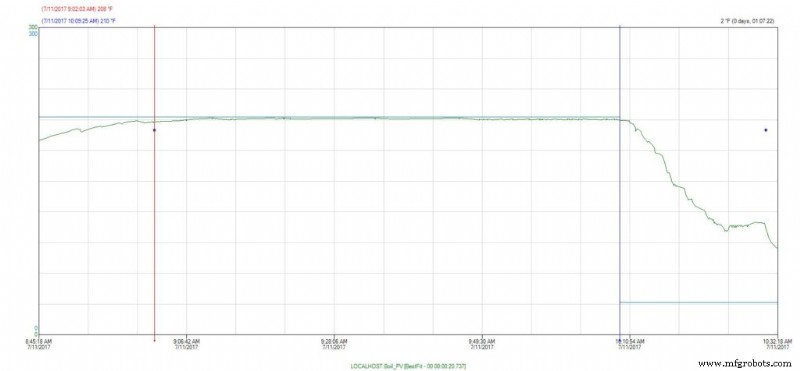
The same thing holds true for the boil phase, our temperature holds at a steady 210° Fahrenheit.
The Break
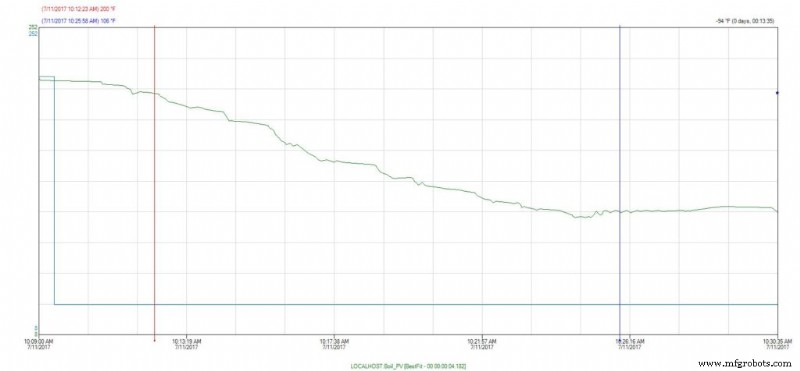
This step is considered critical to the brewing phase, as it is important to bring the Wort (this is what the liquid is called during the brewing process – it’s not beer yet) down to a temperature where it is safe to pitch the yeast. We can see here by our trend that it took approximately 13 minutes to bring the Wort from 200° down to 100° Fahrenheit. All in all, it appears our brew master did an excellent job with this particular batch of beer.
Let’s talk a bit more about the data. We used trends for our initial analysis. Presenting the data visually in this way allow us to quickly spot any anomalies that might have cropped up during the process. If, for example, during the boil phase, if we saw a sudden drop in temperature for a small period of time, then we would start to ask what happened? Did a fuse pop, causing an actual loss in temperature, thus putting the batch in peril? Or did a sensor become detached and thus the data is skewed, but once reattached we could see the temperature was holding constant, so the batch is likely okay? This kind of analysis can become very useful in identifying “what went wrong” if something didn’t pass quality tests for example.
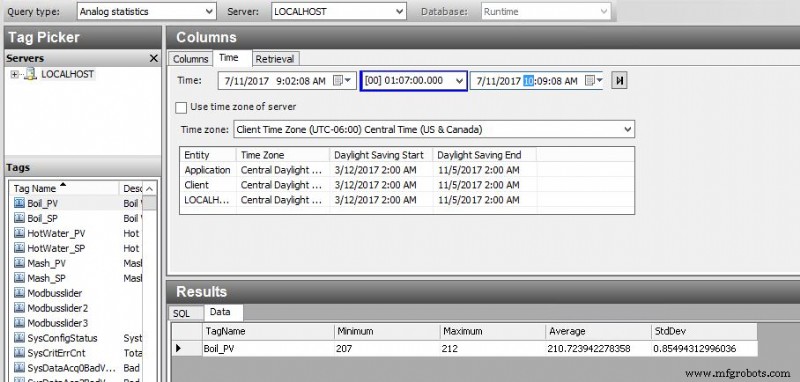
So, what if we just want a simple summary of what happened during the batch? Using the Query tool from our Historian client, I can do a simple summary like this:
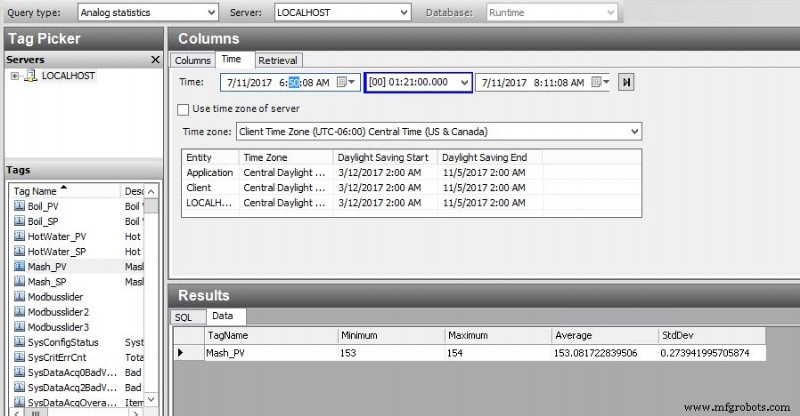
This is a very simple statistical analysis of the temperature of our Wort during the Mash phase. I pulled Min, Max, Average and Standard Deviation. This gives us a great one line view of what happened. I can see that the temperature stayed within one degree of setpoint, and averaged almost exactly at setpoint for the duration of the time.
I can see that there is a slightly larger variation during our Boil process, but still well within acceptable parameters.
Finally, if I really want to do a “deep dive” into the data, I can easily export to Excel which is a familiar tool and I can view the raw data directly, create my own charts and reports for doing additional analysis:
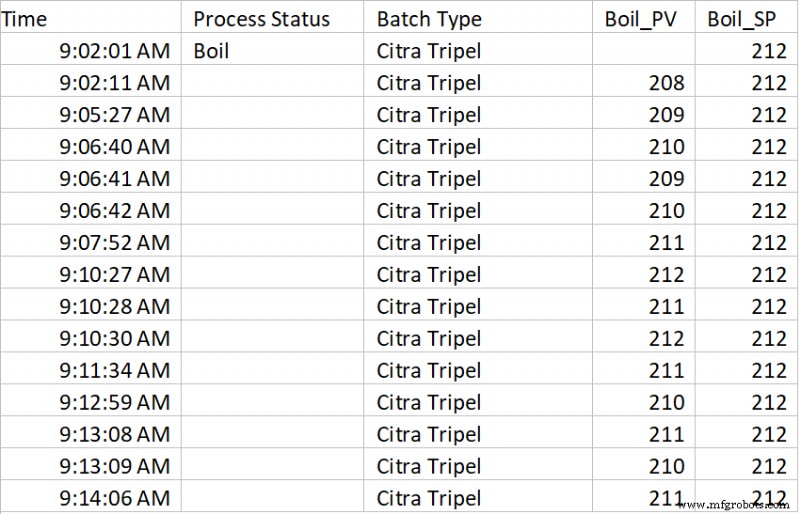
Some additional “Tips and Tricks” for data collection. If we were a real brewery, it would be a very good idea to assign a batch number to this batch, and log that value to Historian as well. Then, the next time I brewed the type of beer “Citra Tripel”, I could go back and compare my latest batch to the previous batch. If my beer taster(s) note anything extraordinary about a particular batch, we can then analyze what happened, and then update our recipe in order to replicate that improvement in future batches, or just compare how we did. Also, using the trend tool, we can pull up data from both batches simultaneously using the “time offset” feature, allowing a nice detailed visual comparison by overlaying both batches within the same trend.
I hope you enjoyed this article. This really just scratches the surface for what automated data collection can do for process improvement. In a future article, I will discuss additional techniques for capturing downtime data and analyzing causes. In addition, I will talk about how we can leverage the data collection system to notify our process team when an event is occurring, instead of analyzing what happened “after the fact”.
Система управления автоматикой
- Пиво
- Представляем надежный завод
- Юбилеи и награды
- Дрю Тройер:Общая эффективность оборудования
- ATS отмечает 25-летие предоставления услуг по техническому обслуживанию предприятий
- Мы идем «наизнанку» на FORWARD IV
- Что такое техническое обслуживание растений?
- GE Digital:путь цифровой трансформации
- Значки в PwC
- Производство на роботах Epson