


Интернет вещей | Метеостанция TensorFlow прогнозирует интенсивность дождя
Компоненты и расходные материалы
| × | 1 | ||||
 |
| × | 1 | |||
| × | 1 | ||||
 |
| × | 1 | |||
 |
| × | 1 | |||
 |
| × | 1 | |||
 |
| × | 2 |
Необходимые инструменты и машины
 |
|
Приложения и онлайн-сервисы
 |
| |||
 |
| |||
 |
|
Об этом проекте
Особенно в 2020 году мгновенные сильные и сильные дожди оказали пагубное воздействие на теплицы и урожайность в моей стране. К сожалению, в наши дни неожиданные и чрезмерные дожди случаются все чаще и стали относительно обычным явлением из-за изменения климата в некоторых районах. Между тем, другие регионы страдают от засухи. По прошествии 2020 года в моем регионе зарегистрировано более тридцати пяти инцидентов, которые привели к потере урожая и скота из-за сильных и сильных дождей. Чтобы внести свой вклад в решение проблем, спровоцированных чрезмерными дождями, таких как снижение продуктивности сельского хозяйства, я рассматривал этот проект как отправную точку.
В первую очередь в этом проекте я сосредоточился на влиянии чрезмерных осадков на сельское хозяйство. Однако обильные осадки могут привести к многочисленным опасностям, например [1]:
- наводнение, включая опасность для жизни человека,
- повреждение зданий и инфраструктуры,
- потеря урожая и скота,
- оползни, которые могут угрожать жизни людей, нарушать работу транспорта и коммуникаций.
Как показали последние исследования, чрезмерные осадки могут влиять на урожайность сельскохозяйственных культур по-разному, включая прямое физическое повреждение, задержку посадки и сбора урожая, ограничение роста корней, дефицит кислорода и потерю питательных веществ. Таким образом, слишком много дождя может быть так же опасно, как засуха для сельского хозяйства: "Данные за последние три десятилетия показывают, что чрезмерное количество осадков может повлиять на урожайность так же сильно, как чрезмерная жара и засуха. В новом исследовании междисциплинарная группа специалистов Университет Иллинойса связал данные о страховании урожая, климате, почве и урожайности кукурузы с 1981 по 2016 год. Исследование показало, что в течение нескольких лет чрезмерные осадки снижали урожайность кукурузы в США на целых 34% по сравнению с ожидаемой урожайностью. Данные показывают, что засуха и чрезмерная жара вызвали потерю урожая до 37% в течение нескольких лет [2] » .
К сожалению, систем раннего предупреждения недостаточно для полного предотвращения усугубляющих последствий чрезмерных осадков для сельскохозяйственных продуктов и процессов без адекватных и предварительных местных данных о погоде для каждой теплицы или фермы. Поэтому, в надежде предотвратить пагубные последствия чрезмерных осадков для сельского хозяйства, я решил создать этот проект как экономичную удаленную метеостанцию для сбора и интерпретации местной информации о погоде, чтобы делать более точные прогнозы интенсивности осадков.
Проведя небольшое исследование глубокого обучения и нейронных сетей, я решил построить искусственную нейронную сеть (ИНС) на основе модели классификации для интерпретации накопленных локальных данных о погоде для прогнозирования интенсивности дождя в соответствии с заданными классами. Как показано в следующем исследовании, исследователи применяли различные модели и типы нейронных сетей для прогнозирования не только осадков, но и погодных явлений: «Во многих экспериментах использовались нейронные сети для прогнозирования количественного количества осадков в различных местах и в прогнозных диапазонах. Ведь Например, исследователи в Таиланде смогли получить высокоточные прогнозы с помощью нейронных сетей с прямой связью для прогнозирования количественных значений осадков в диапазоне от одного до трех часов с упреждением, чтобы предсказать возможные опасности наводнения. Нейронные сети также использовались для прогнозирования погодные явления помимо традиционных значений прогноза, таких как вероятность / количество осадков, скорость ветра, атмосферное давление и т. д. Они очень успешно использовались для прогнозирования торнадо. Кроме того, исследователи в Австралии успешно использовали нейронную сеть для определения тумана при различных прогнозах колеблется от 3 до 18 часов в международном аэропорту Канберры [3] ».
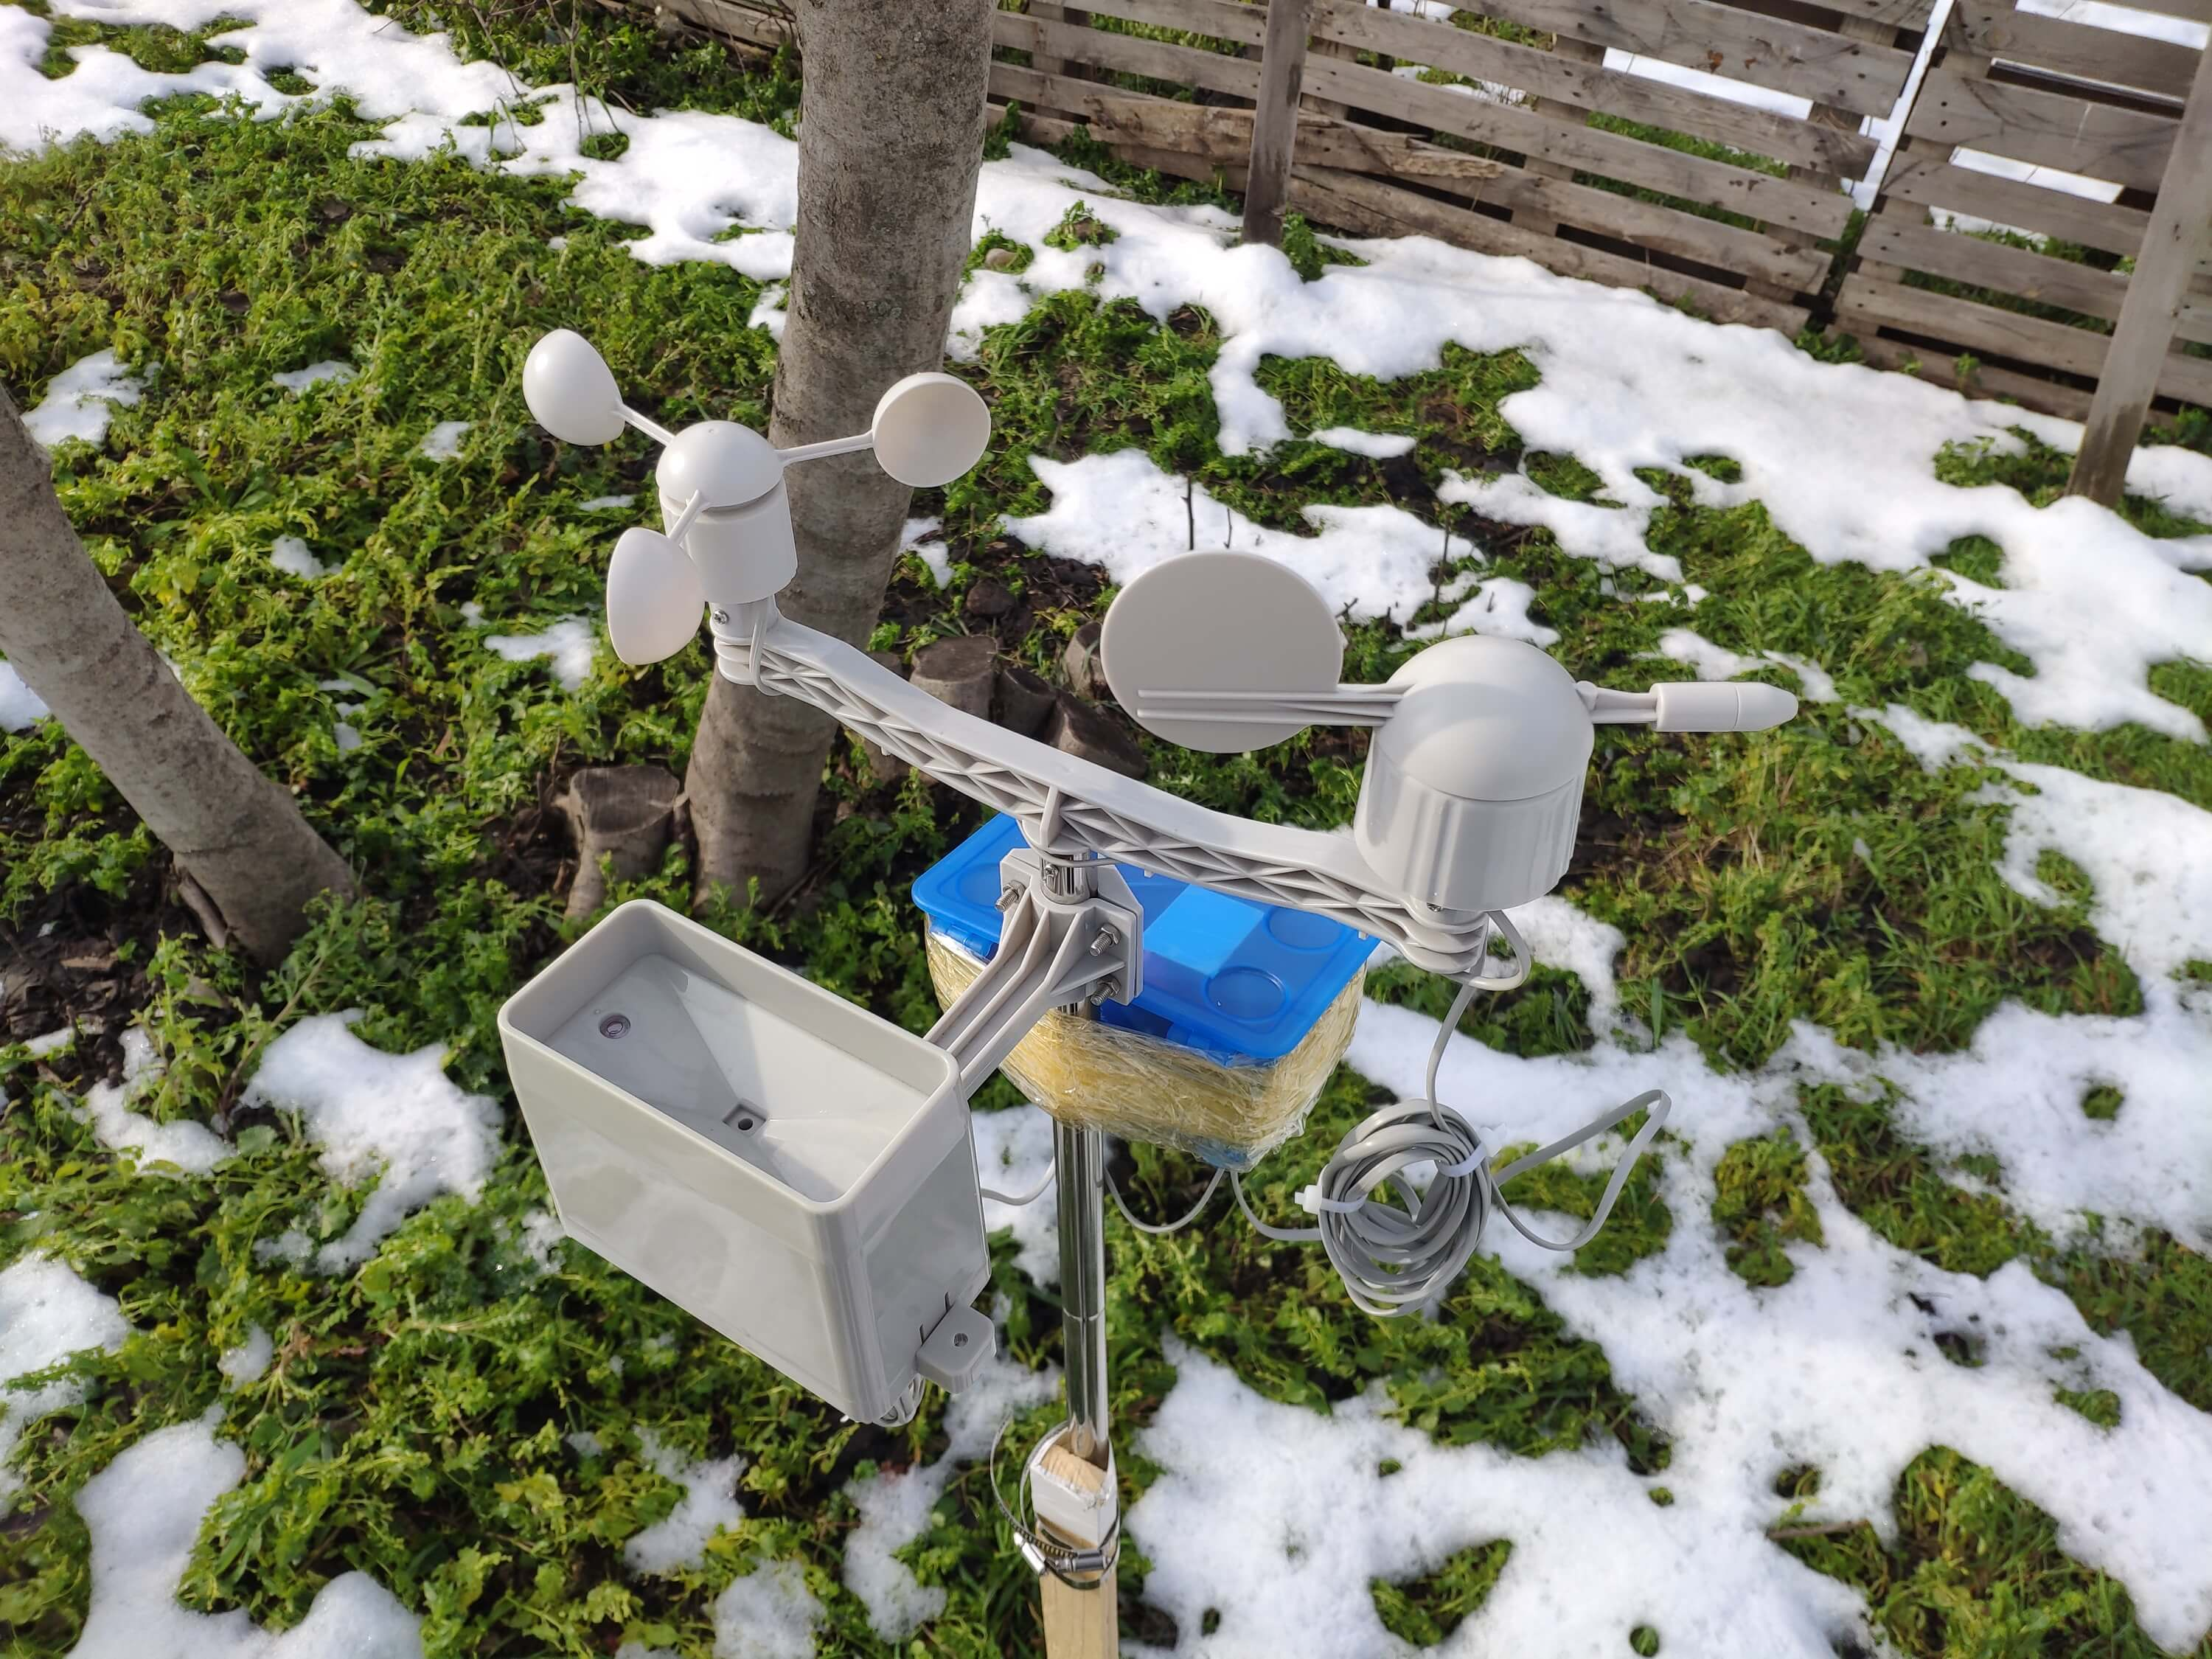
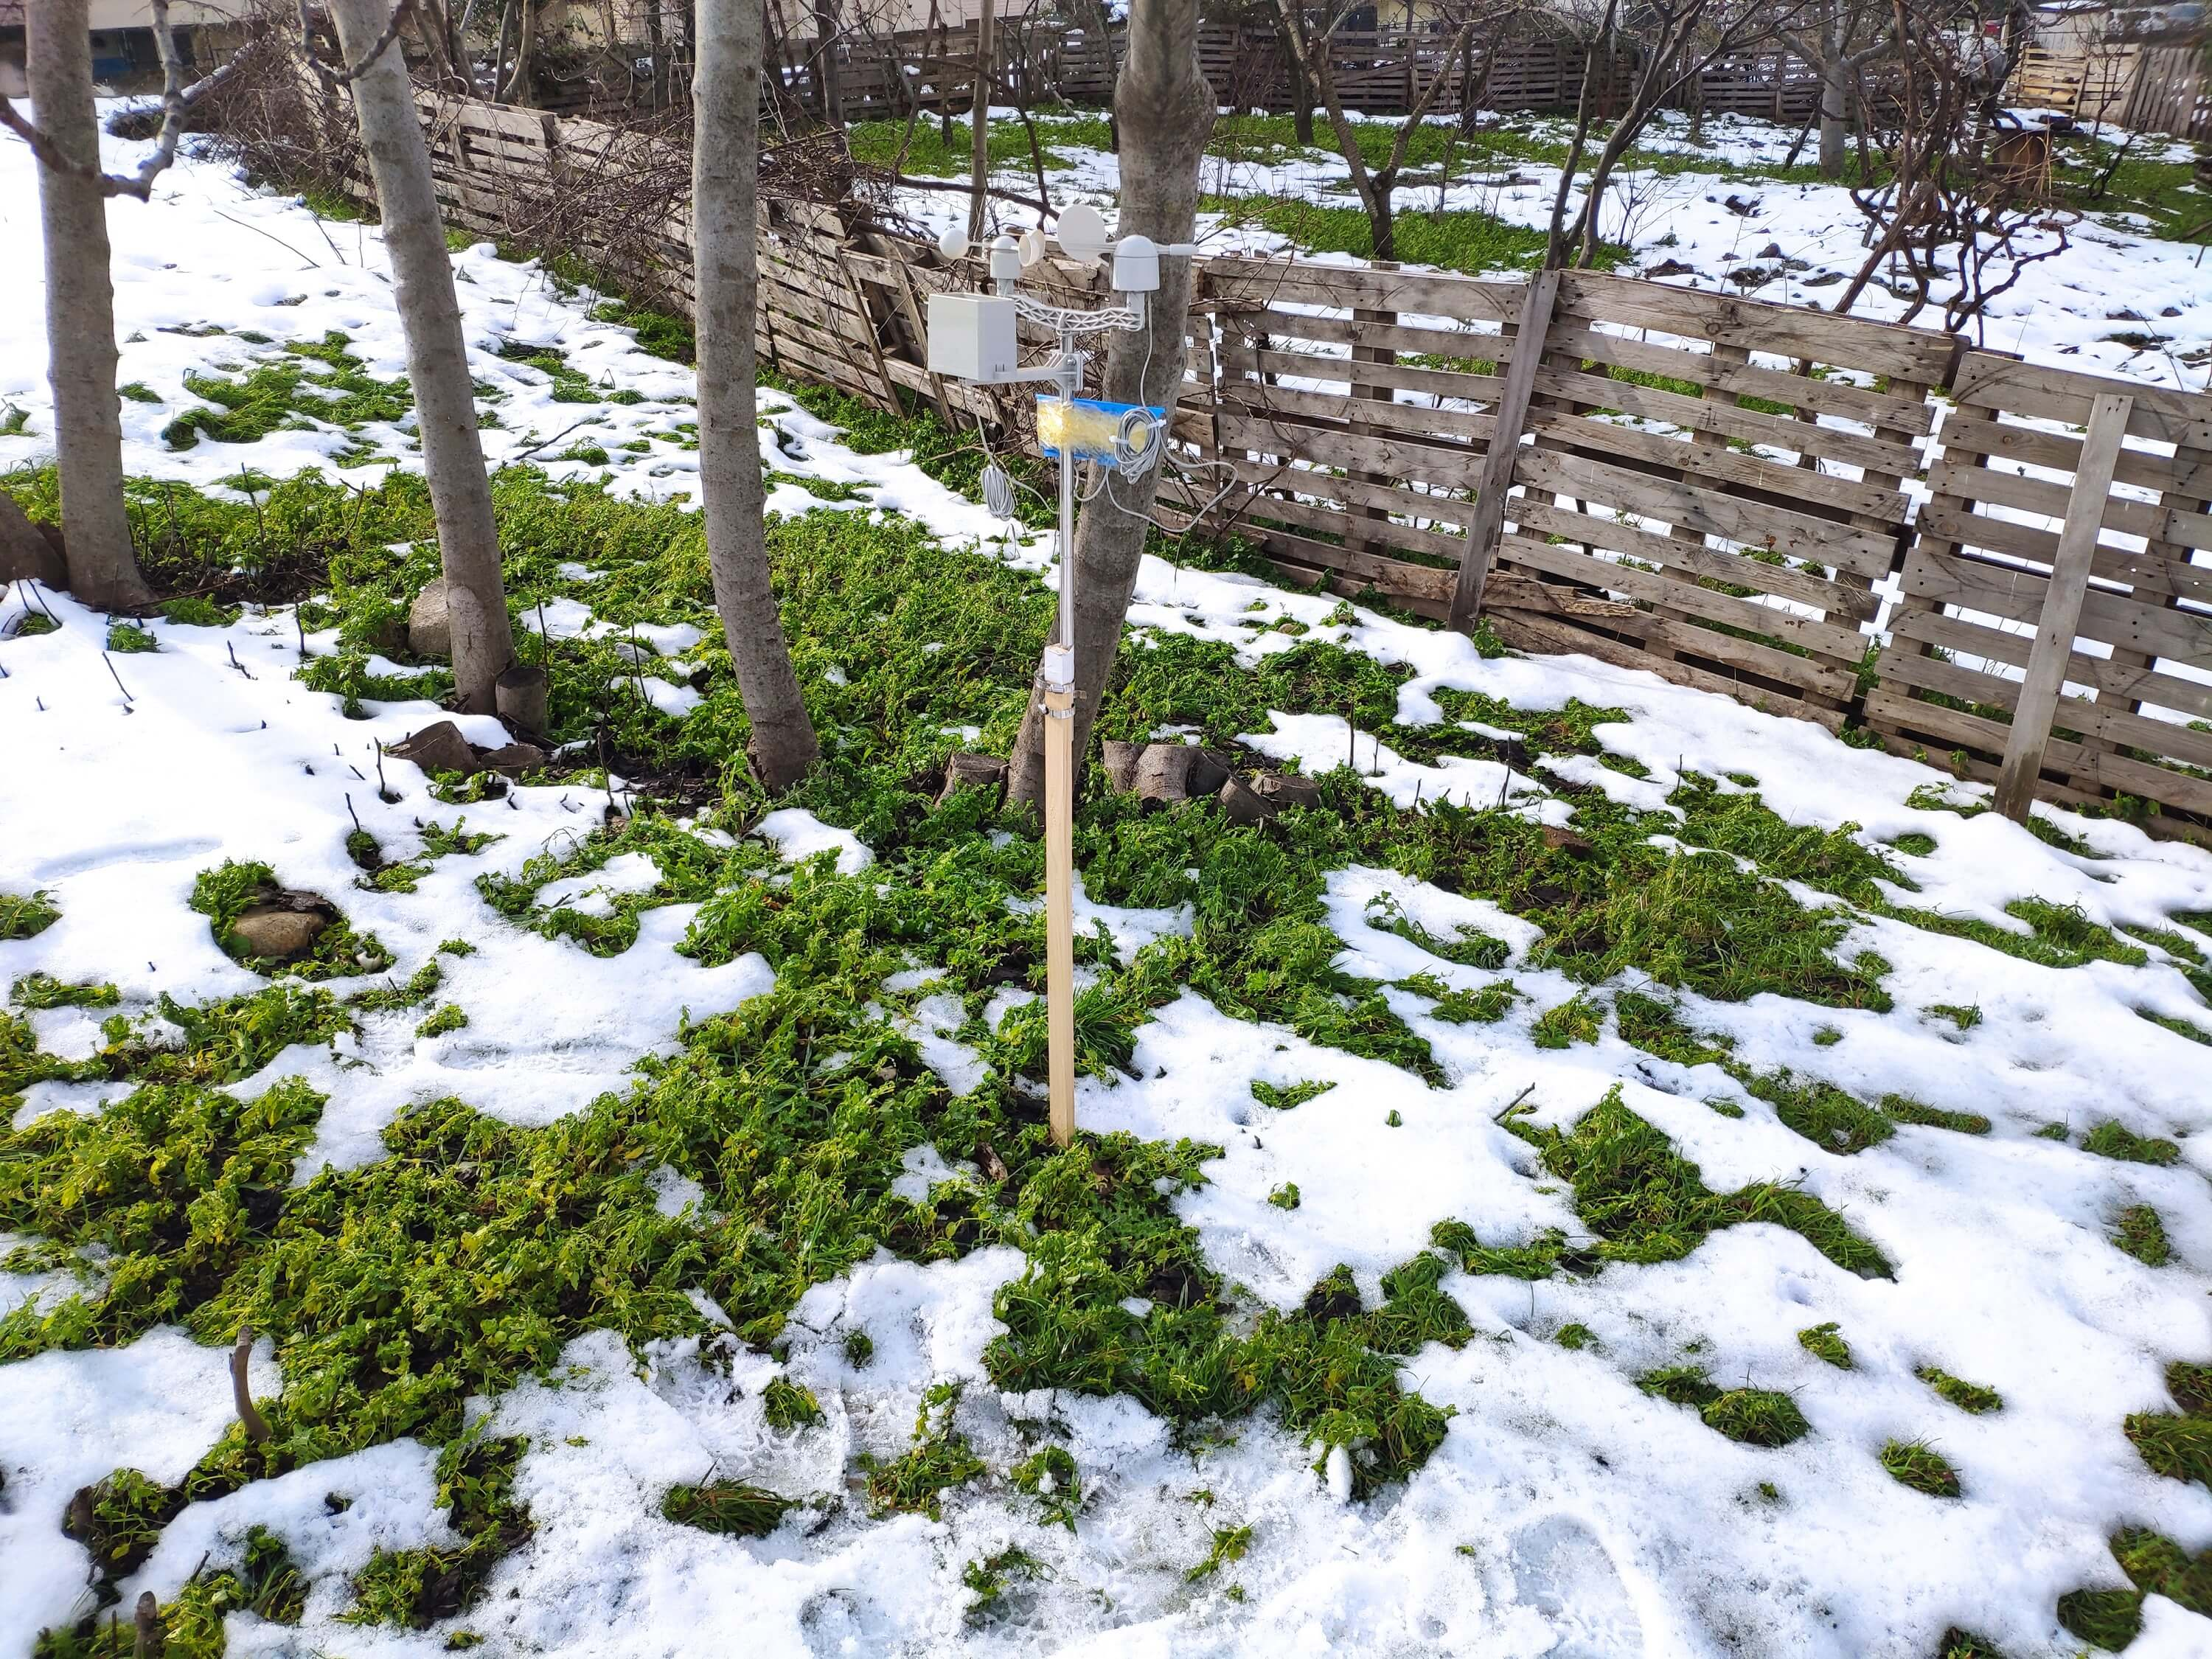
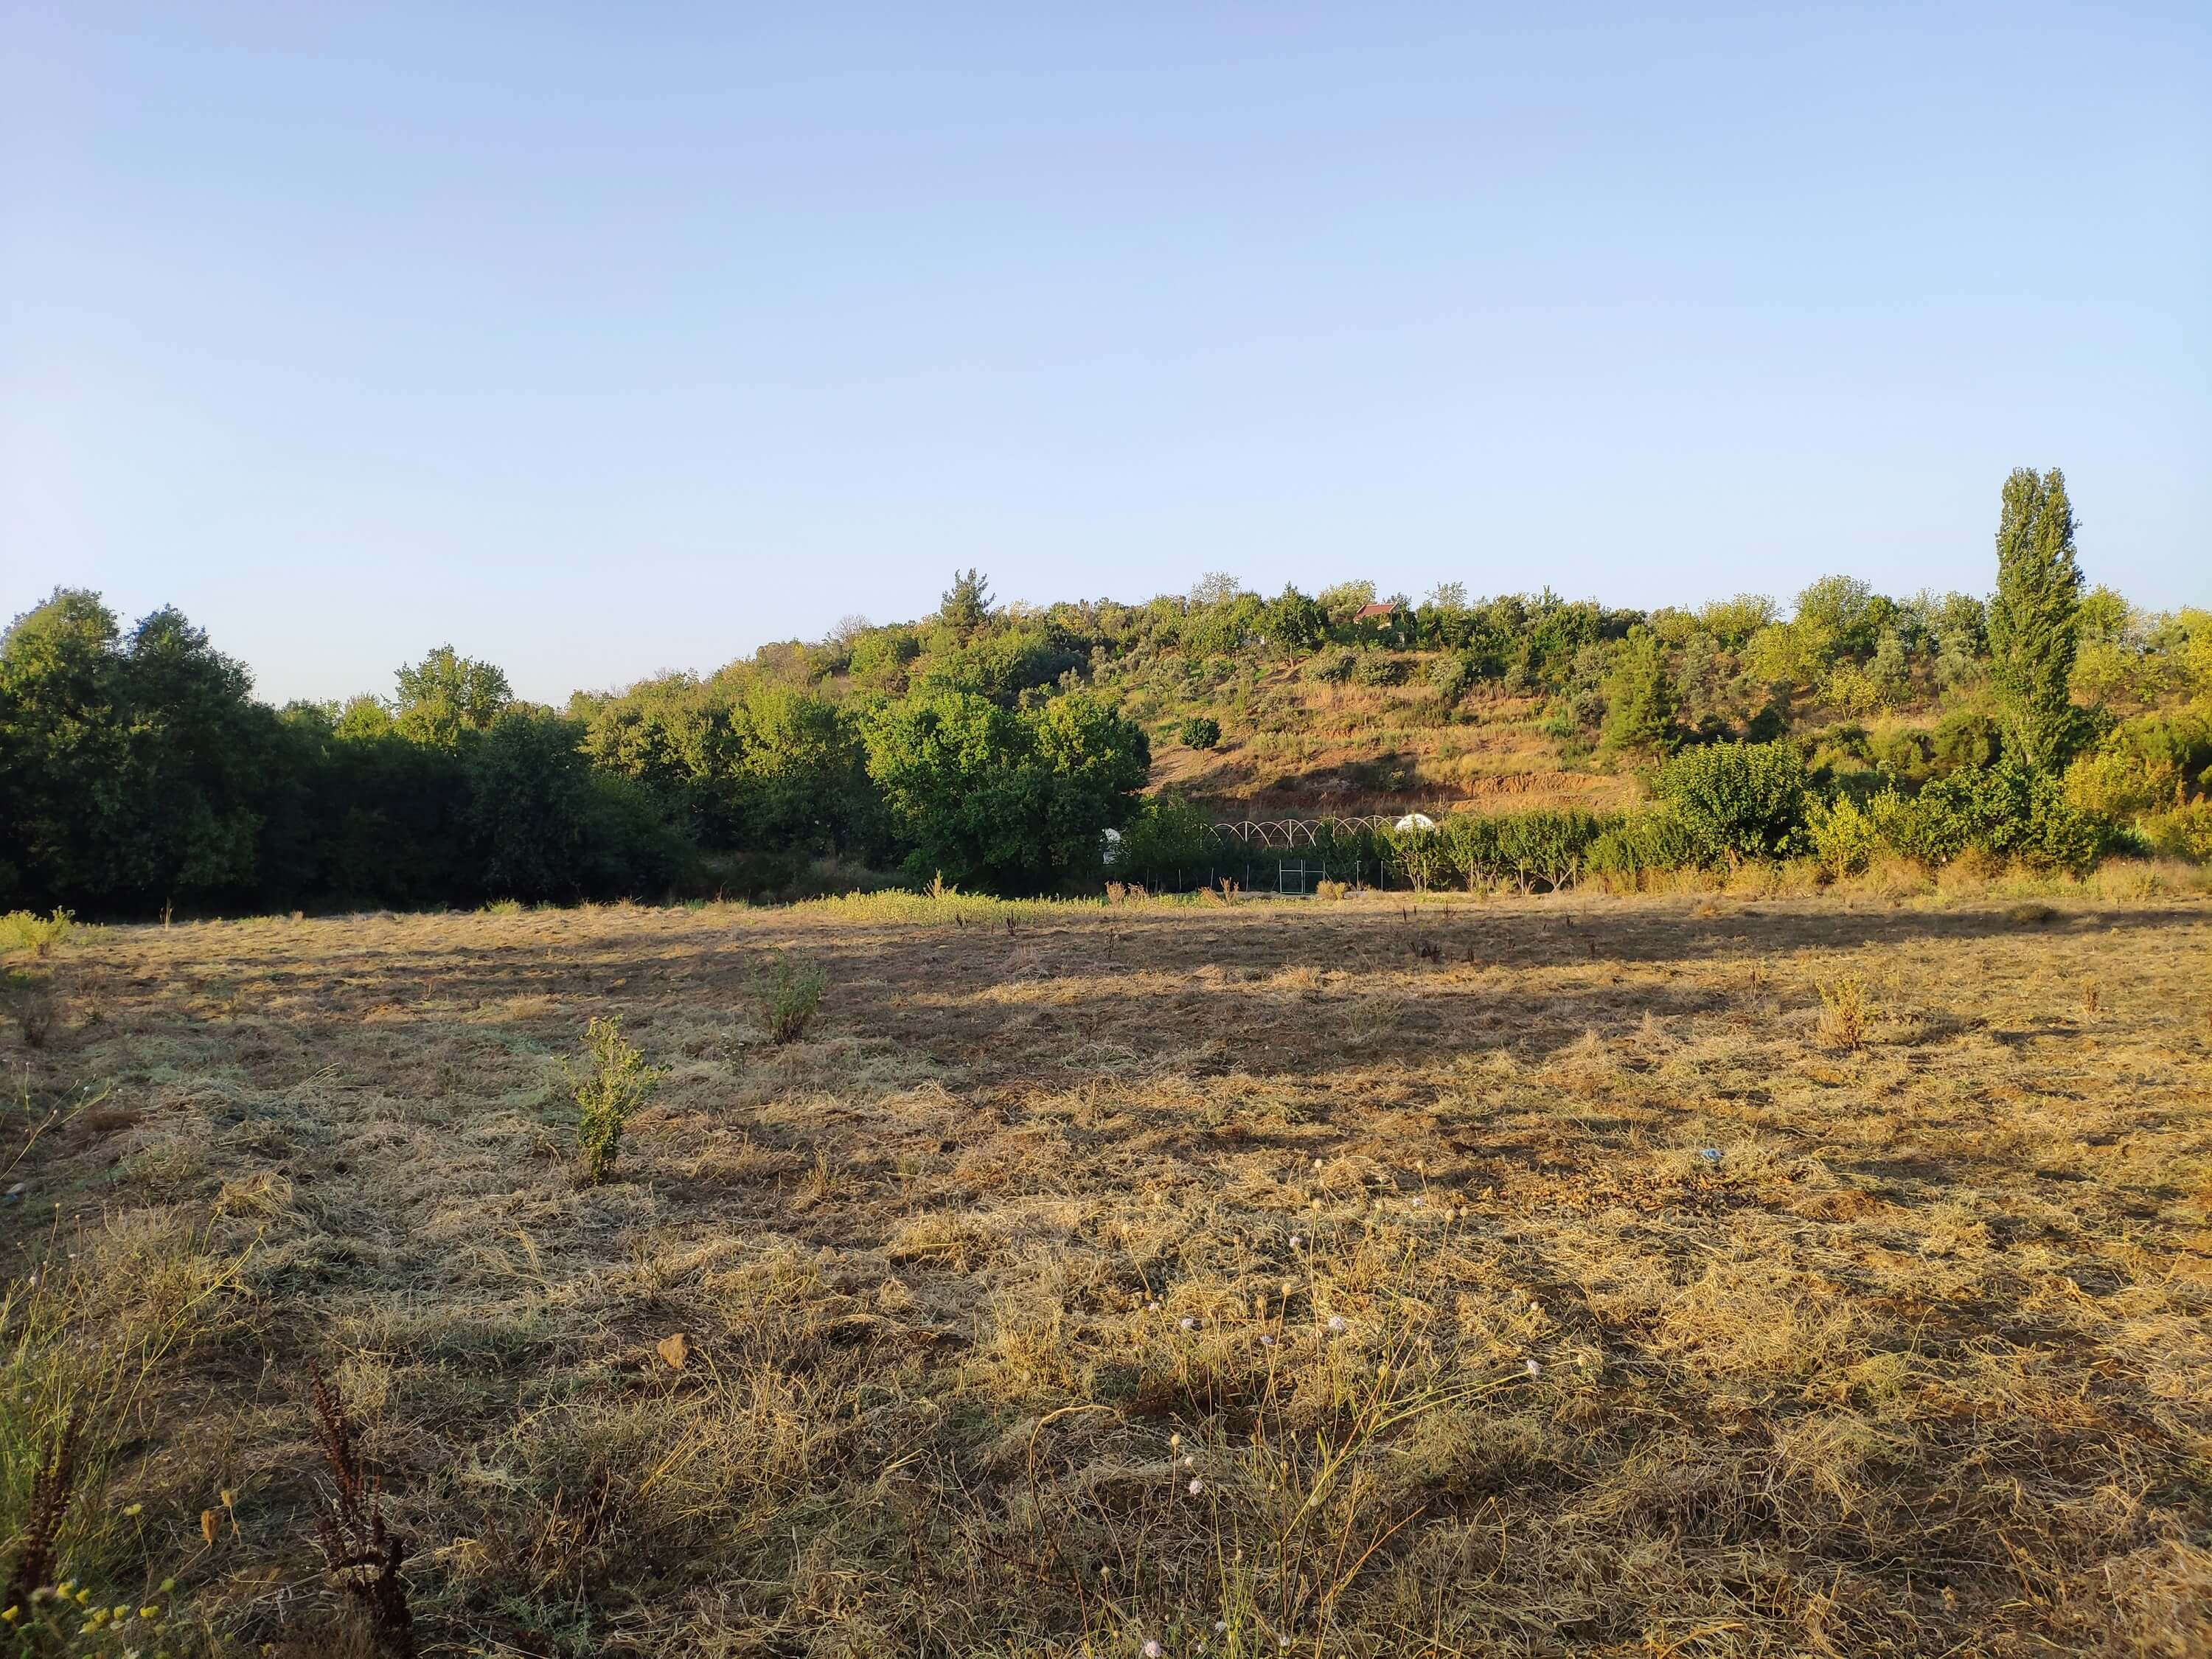
Прежде чем построить и протестировать свою модель нейронной сети, я более трех месяцев собирал данные о погоде на своем балконе и во дворе в радиусе трех километров, чтобы создать локальный набор данных о погоде, показывающий информацию о погоде в моем районе. Чтобы получить информацию о погоде даже в экстремальных погодных условиях, я использовал комплект метеостанции с анемометром, флюгером и дождевым ведром от DFRobot с двумя разными досками для разработки:
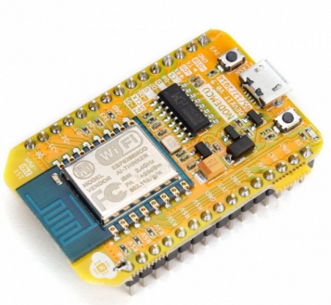
- NodeMCU ESP-12E (с поддержкой Wi-Fi)
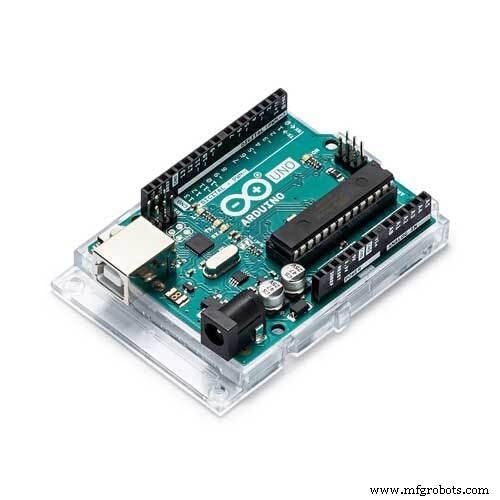
- Arduino Uno + DFRobot SIM808 GPS / GPRS / GSM Shield (с поддержкой GPRS)
Таким образом, я мог передавать данные о погоде через Wi-Fi на моем балконе или через GPRS, если расстояние между моим маршрутизатором и метеостанцией слишком велико.
Я решил использовать Google Sheets, облачную программу для работы с электронными таблицами, чтобы сопоставить данные о погоде, генерируемые метеостанцией, потому что с помощью API Google Sheets просто создавать большие наборы данных и добавлять новую информацию. Поэтому я разработал веб-приложение на PHP для получения данных о погоде, передаваемых досками разработки, и добавления их в электронную таблицу в Google Таблицах.
После завершения сбора данных о погоде в течение более трех месяцев каждые пять минут я построил модель искусственной нейронной сети (ИНС) с помощью TensorFlow, чтобы делать прогнозы интенсивности дождя. Теоретически я назначил класс интенсивности дождя для каждого показания после масштабирования и нормализации набора данных. Затем я обучил модель нейронной сети классифицировать эти классы:
- Без осадков
- Небольшой дождь
- Умеренное количество осадков
- Сильный дождь
- Сильный дождь
Итак, это вкратце мой проект 😃
На следующих этапах вы можете найти более подробную информацию о кодировании, сборе локальных данных о погоде и построении модели искусственной нейронной сети (ИНС) с помощью TensorFlow.
Огромное спасибо DFRobot за спонсирование этого проекта.
Спонсируемые продукты DFRobot:
⭐ Комплект метеостанции с анемометром / флюгером / дождевым ведром | Осмотреть
⭐ SIM808 GPS / GPRS / GSM Shield для Arduino | Осмотреть
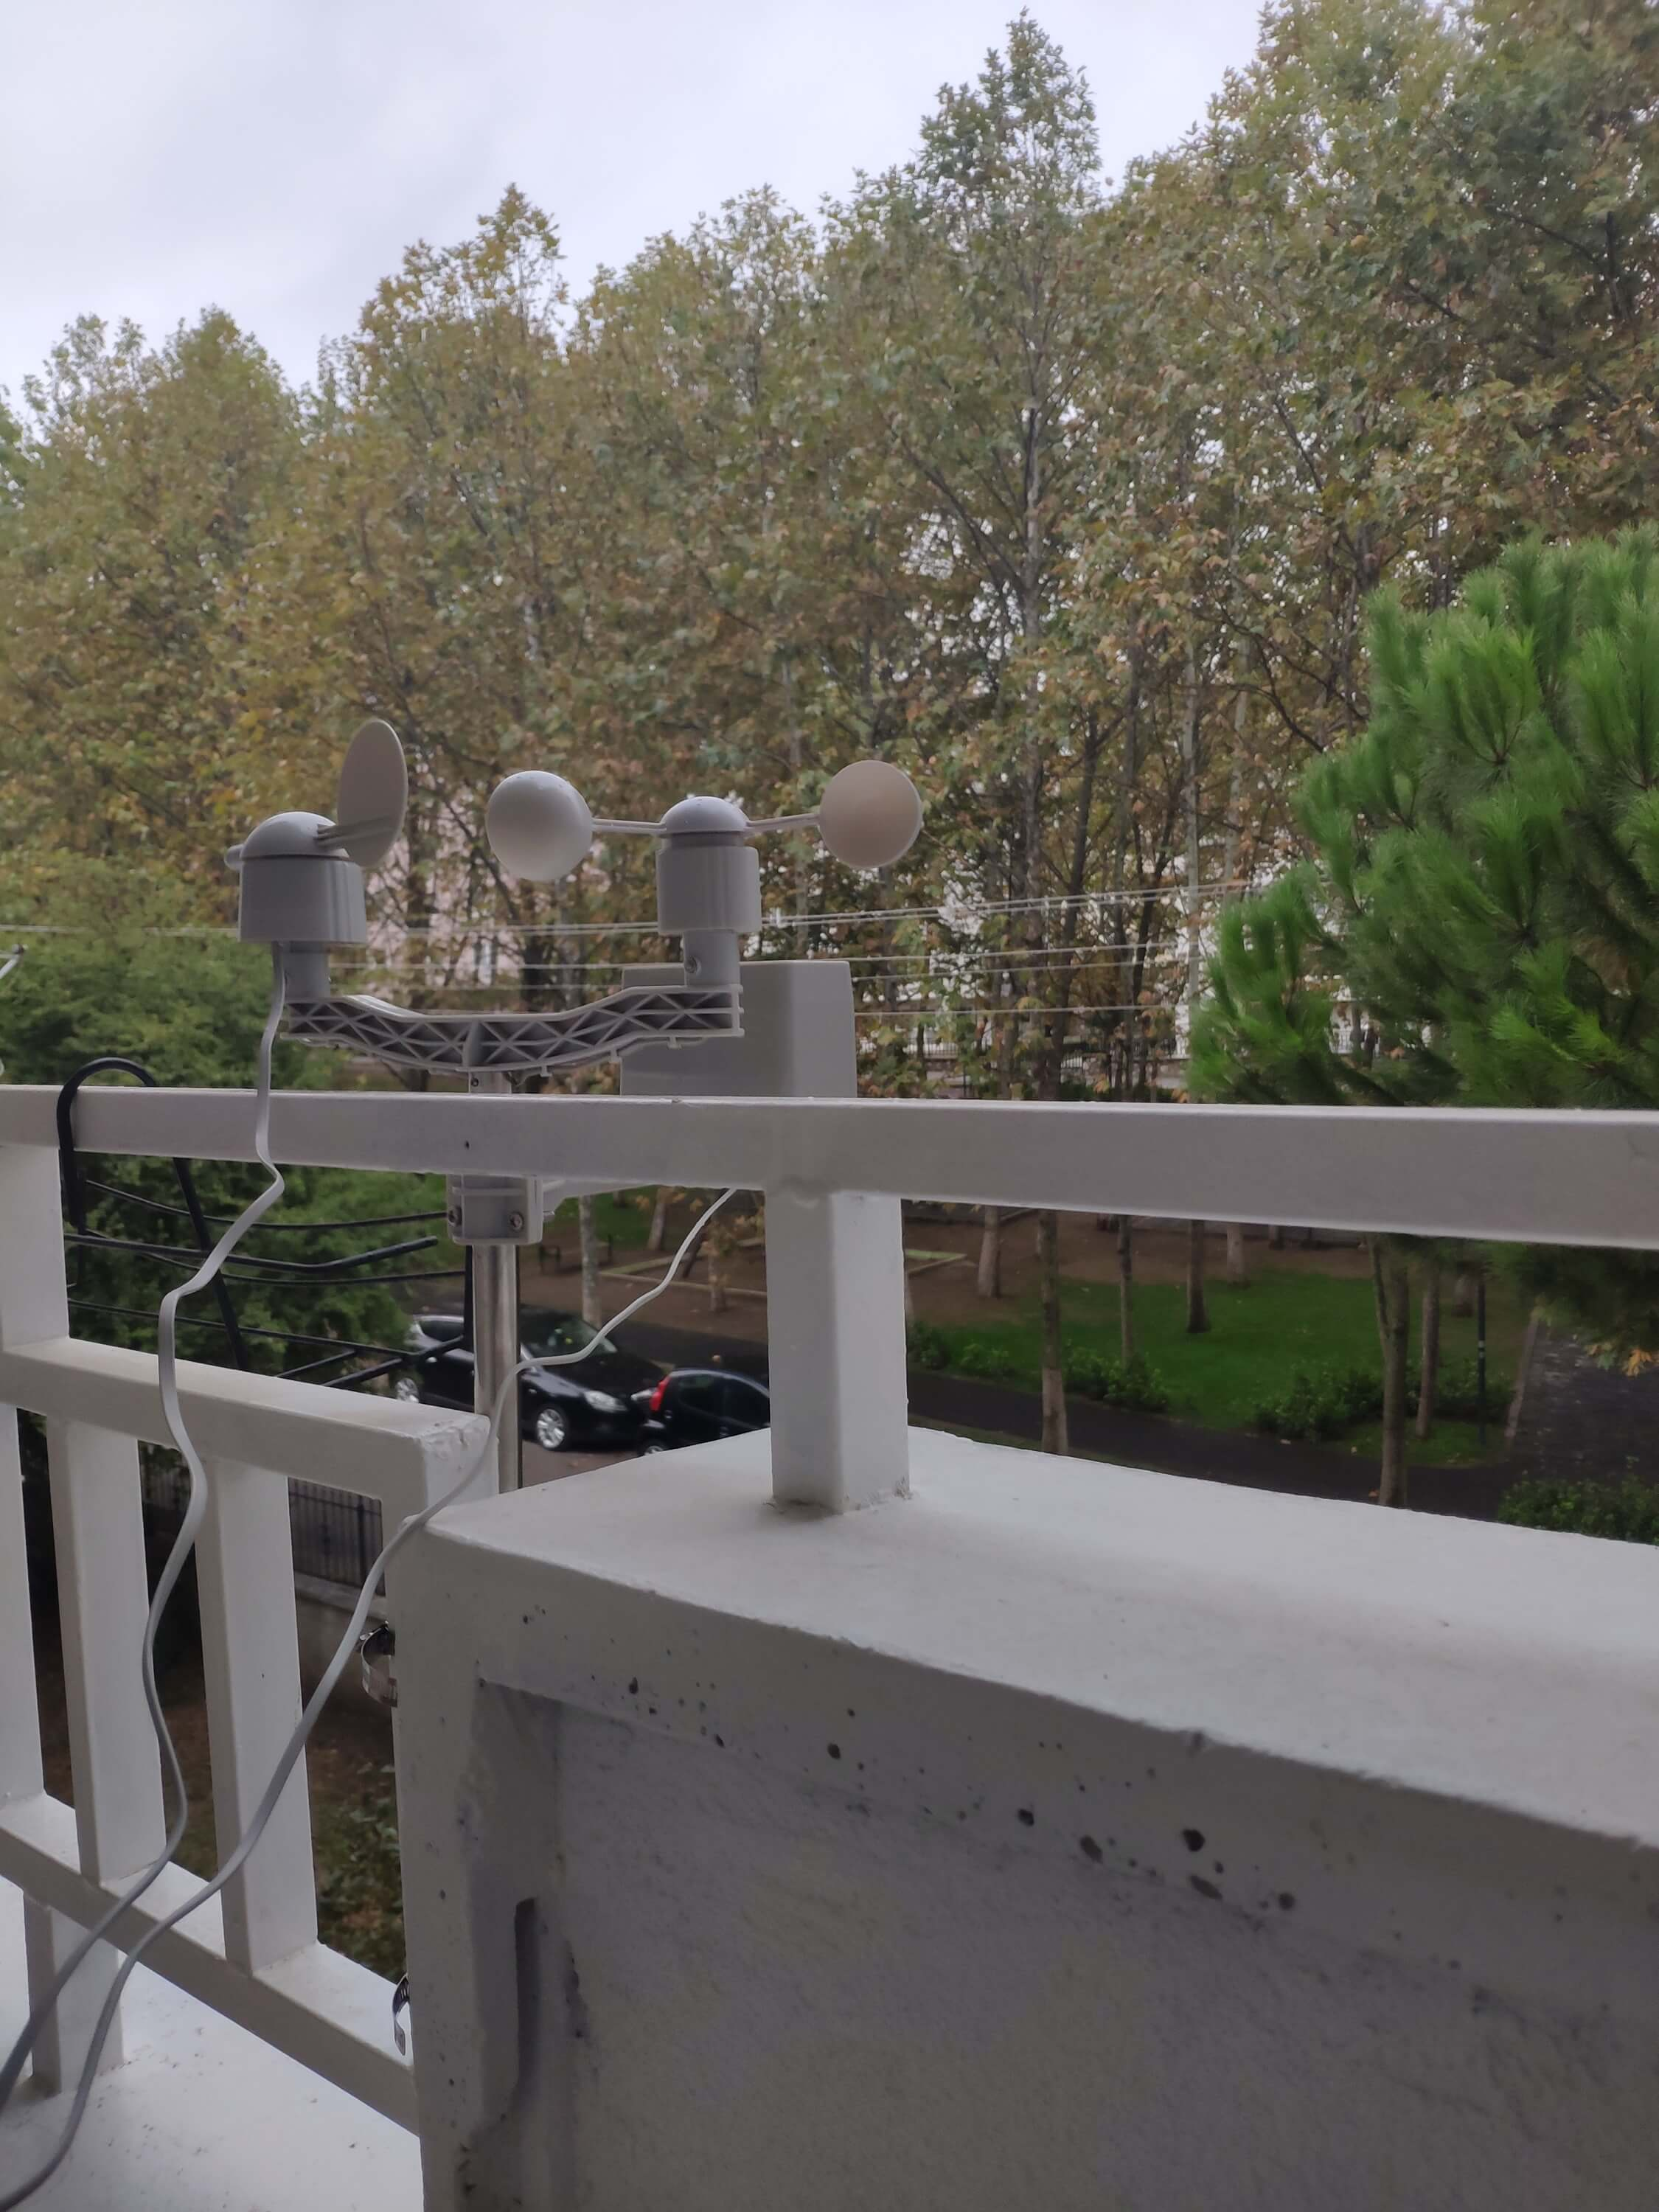
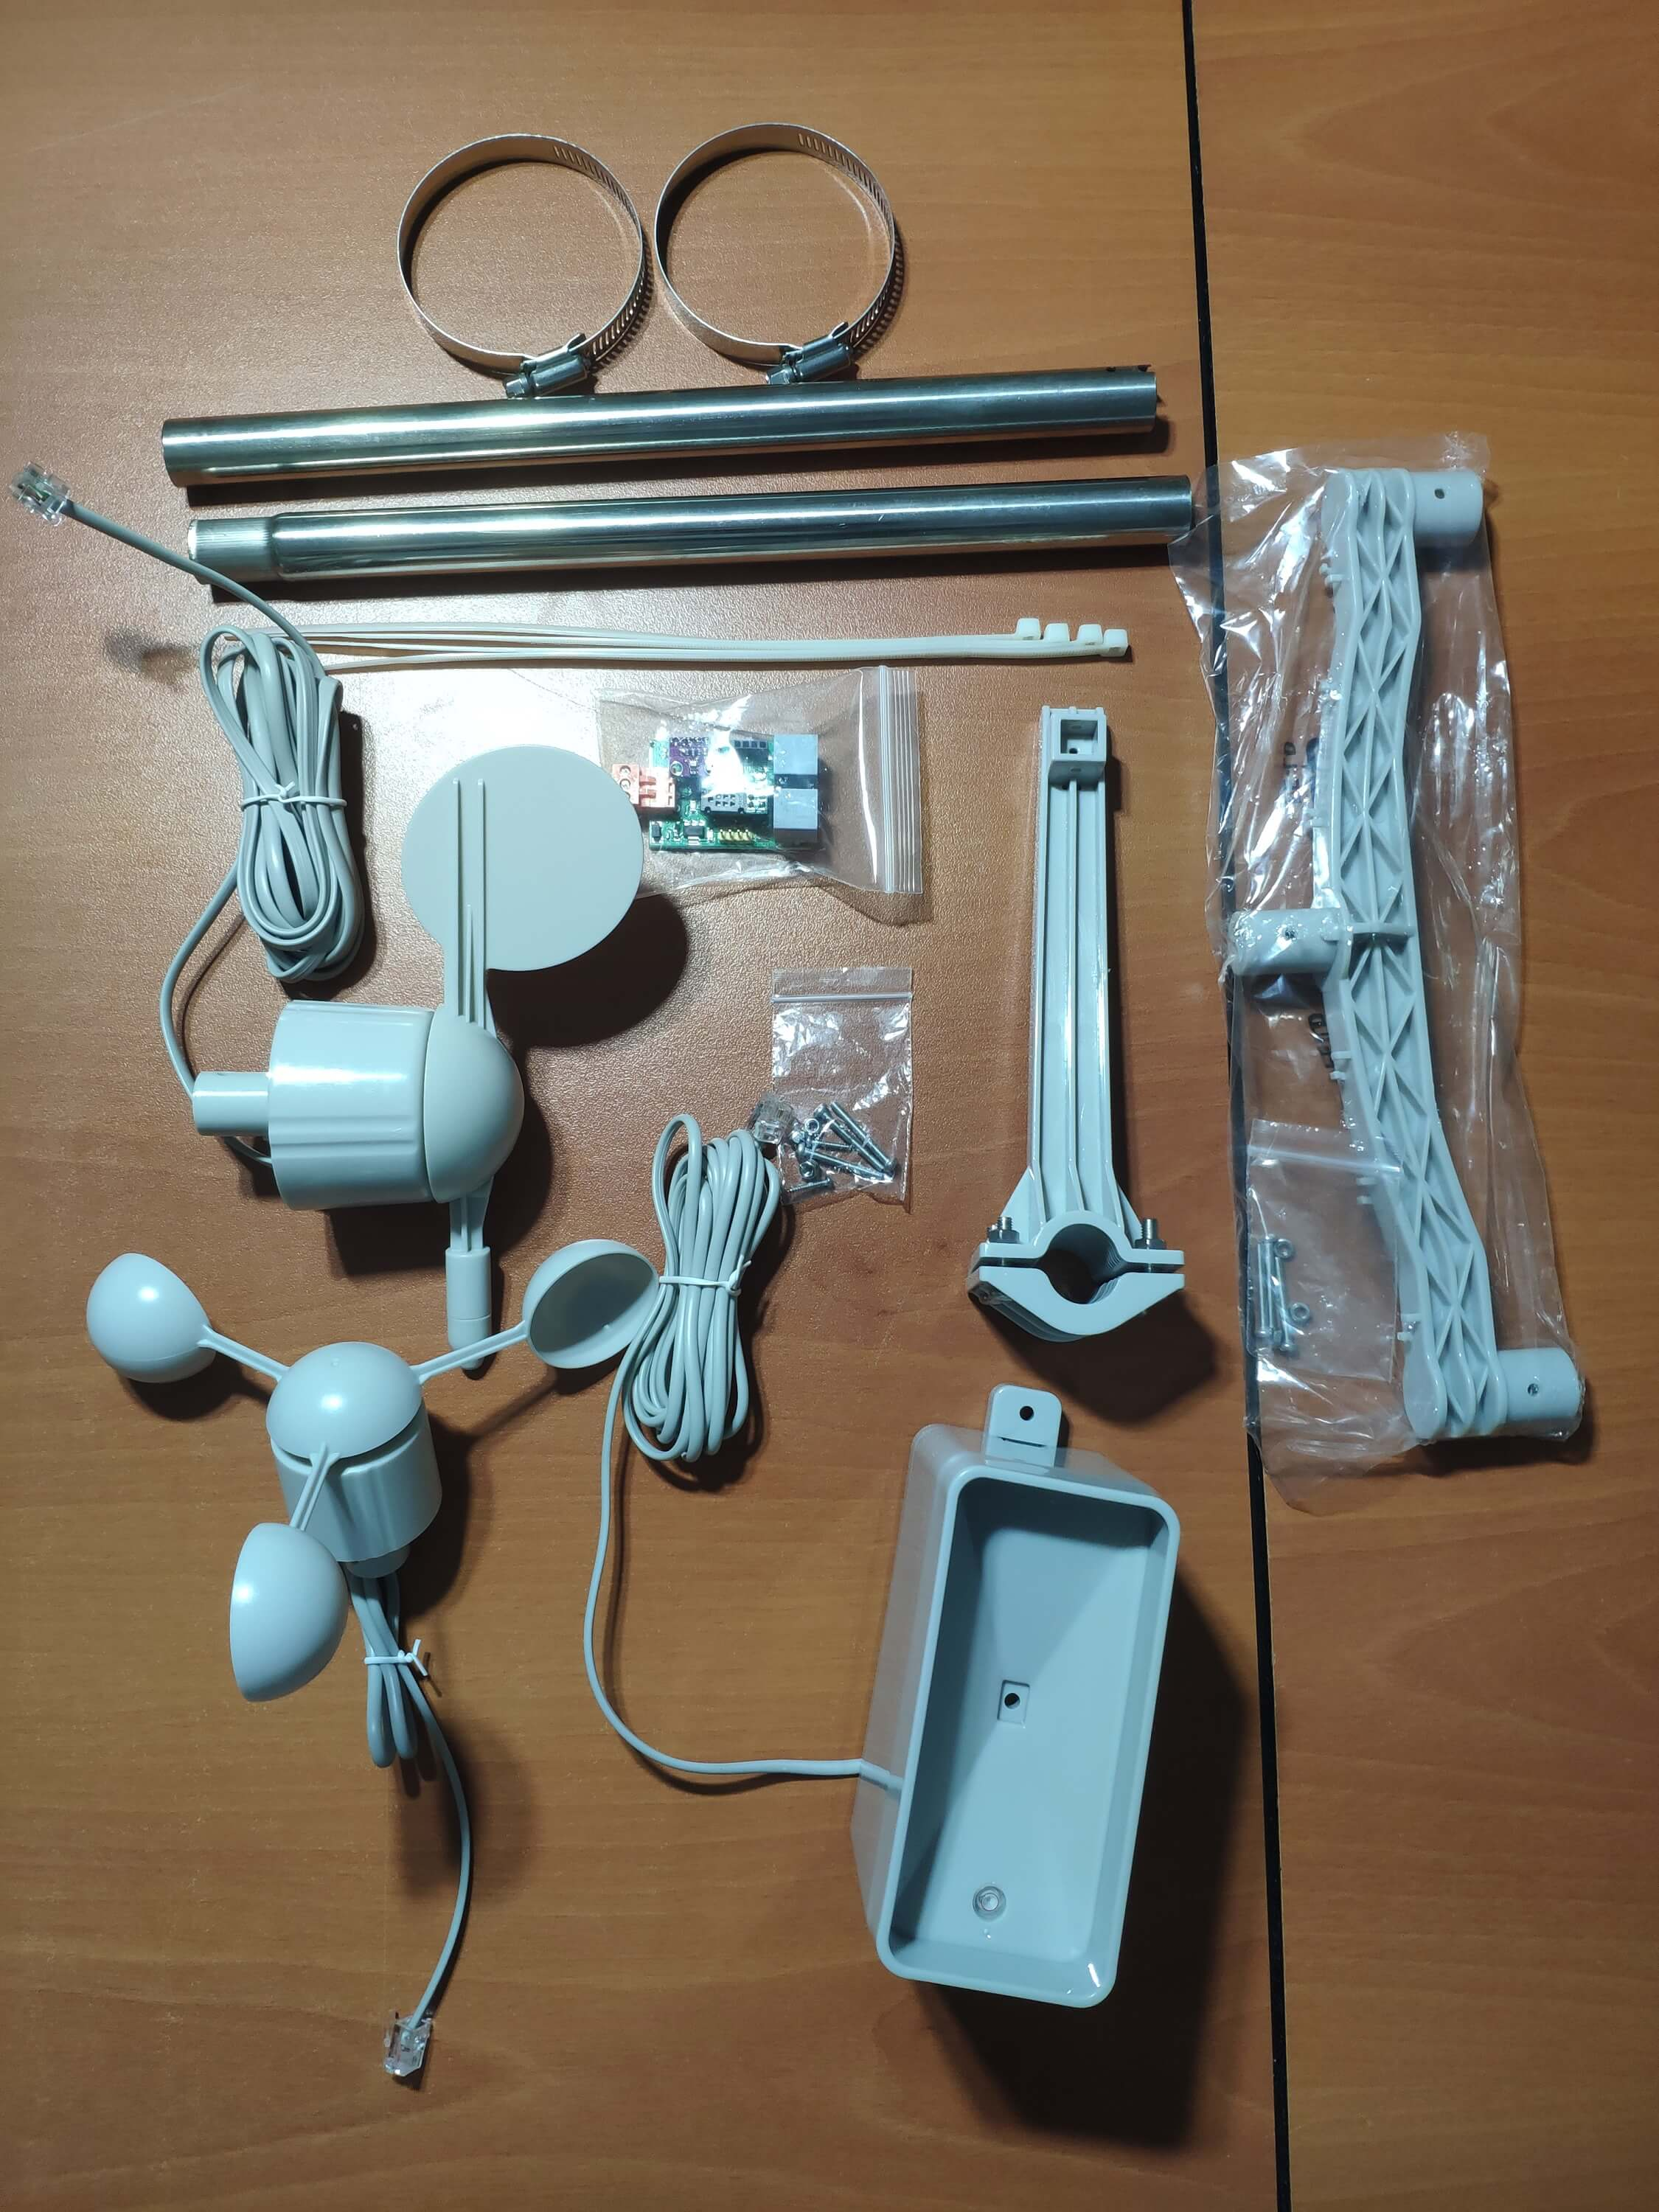
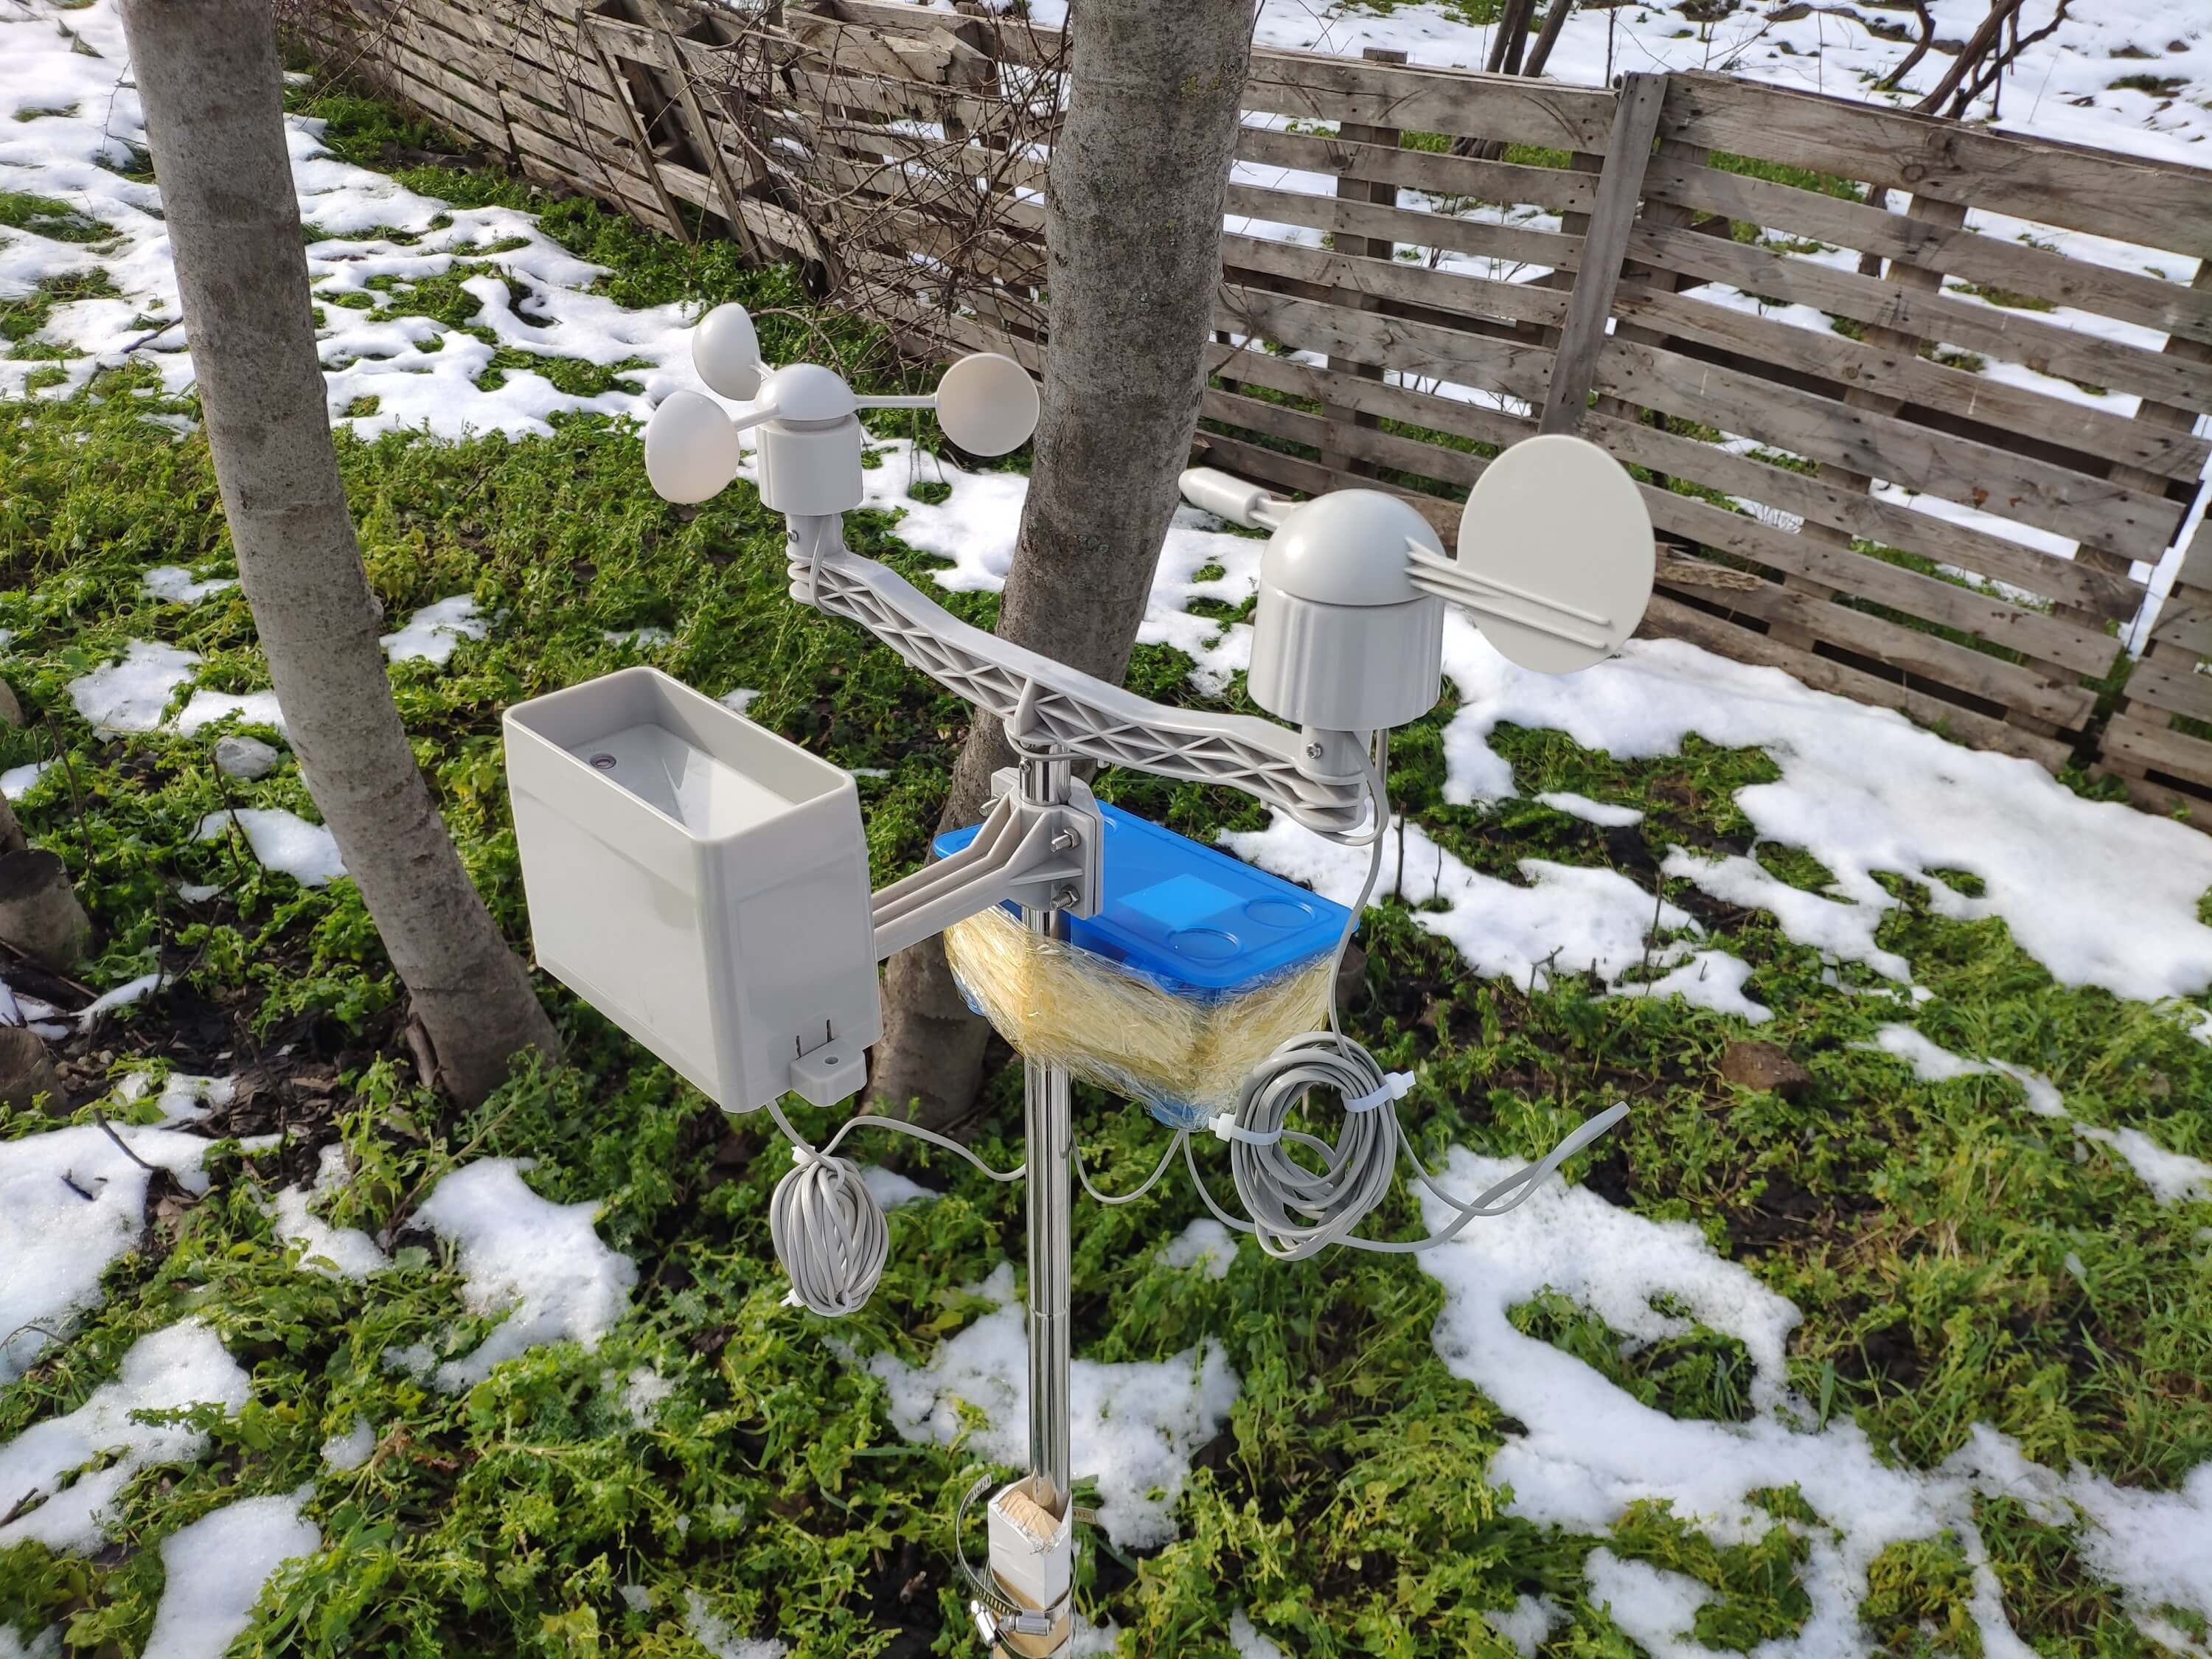
Шаг 1. Сборка комплекта метеостанции с анемометром, флюгером и ведром для дождя
Этот комплект метеостанции включает анемометр, ветровую лозу, ведро для дождя и плату датчиков для отправки данных о погоде по протоколу последовательной связи. Таким образом, с досками разработки легко собирать локальные данные о погоде.
Он выводит 37 байтов в секунду, включая конец CR / LF .
c000s000g000t086r000p000h53b10020 Парсер данных:
- c000 : Направление воздуха, град.
- s000 : Скорость воздуха (средняя), 0,1 мили в час.
- g000 : Скорость воздуха (макс.) 0,1 мили в час.
- t086 : Температура, по Фаренгейту.
- r000 : Количество осадков (1 час), 0,01 дюйма
- p000 : Количество осадков (24 часа), 0,01 дюйма
- h53 : Влажность,% (00 % =100)
- b10020 : Атмосфера, 0,1 гПа
⭐ Прежде всего, прикрепите анемометр и флюгер к мосту с помощью винтов и гаек.
⭐ Подключите флюгер к анемометру с помощью телефонного кабеля RJ11 и затяните его под мостом.
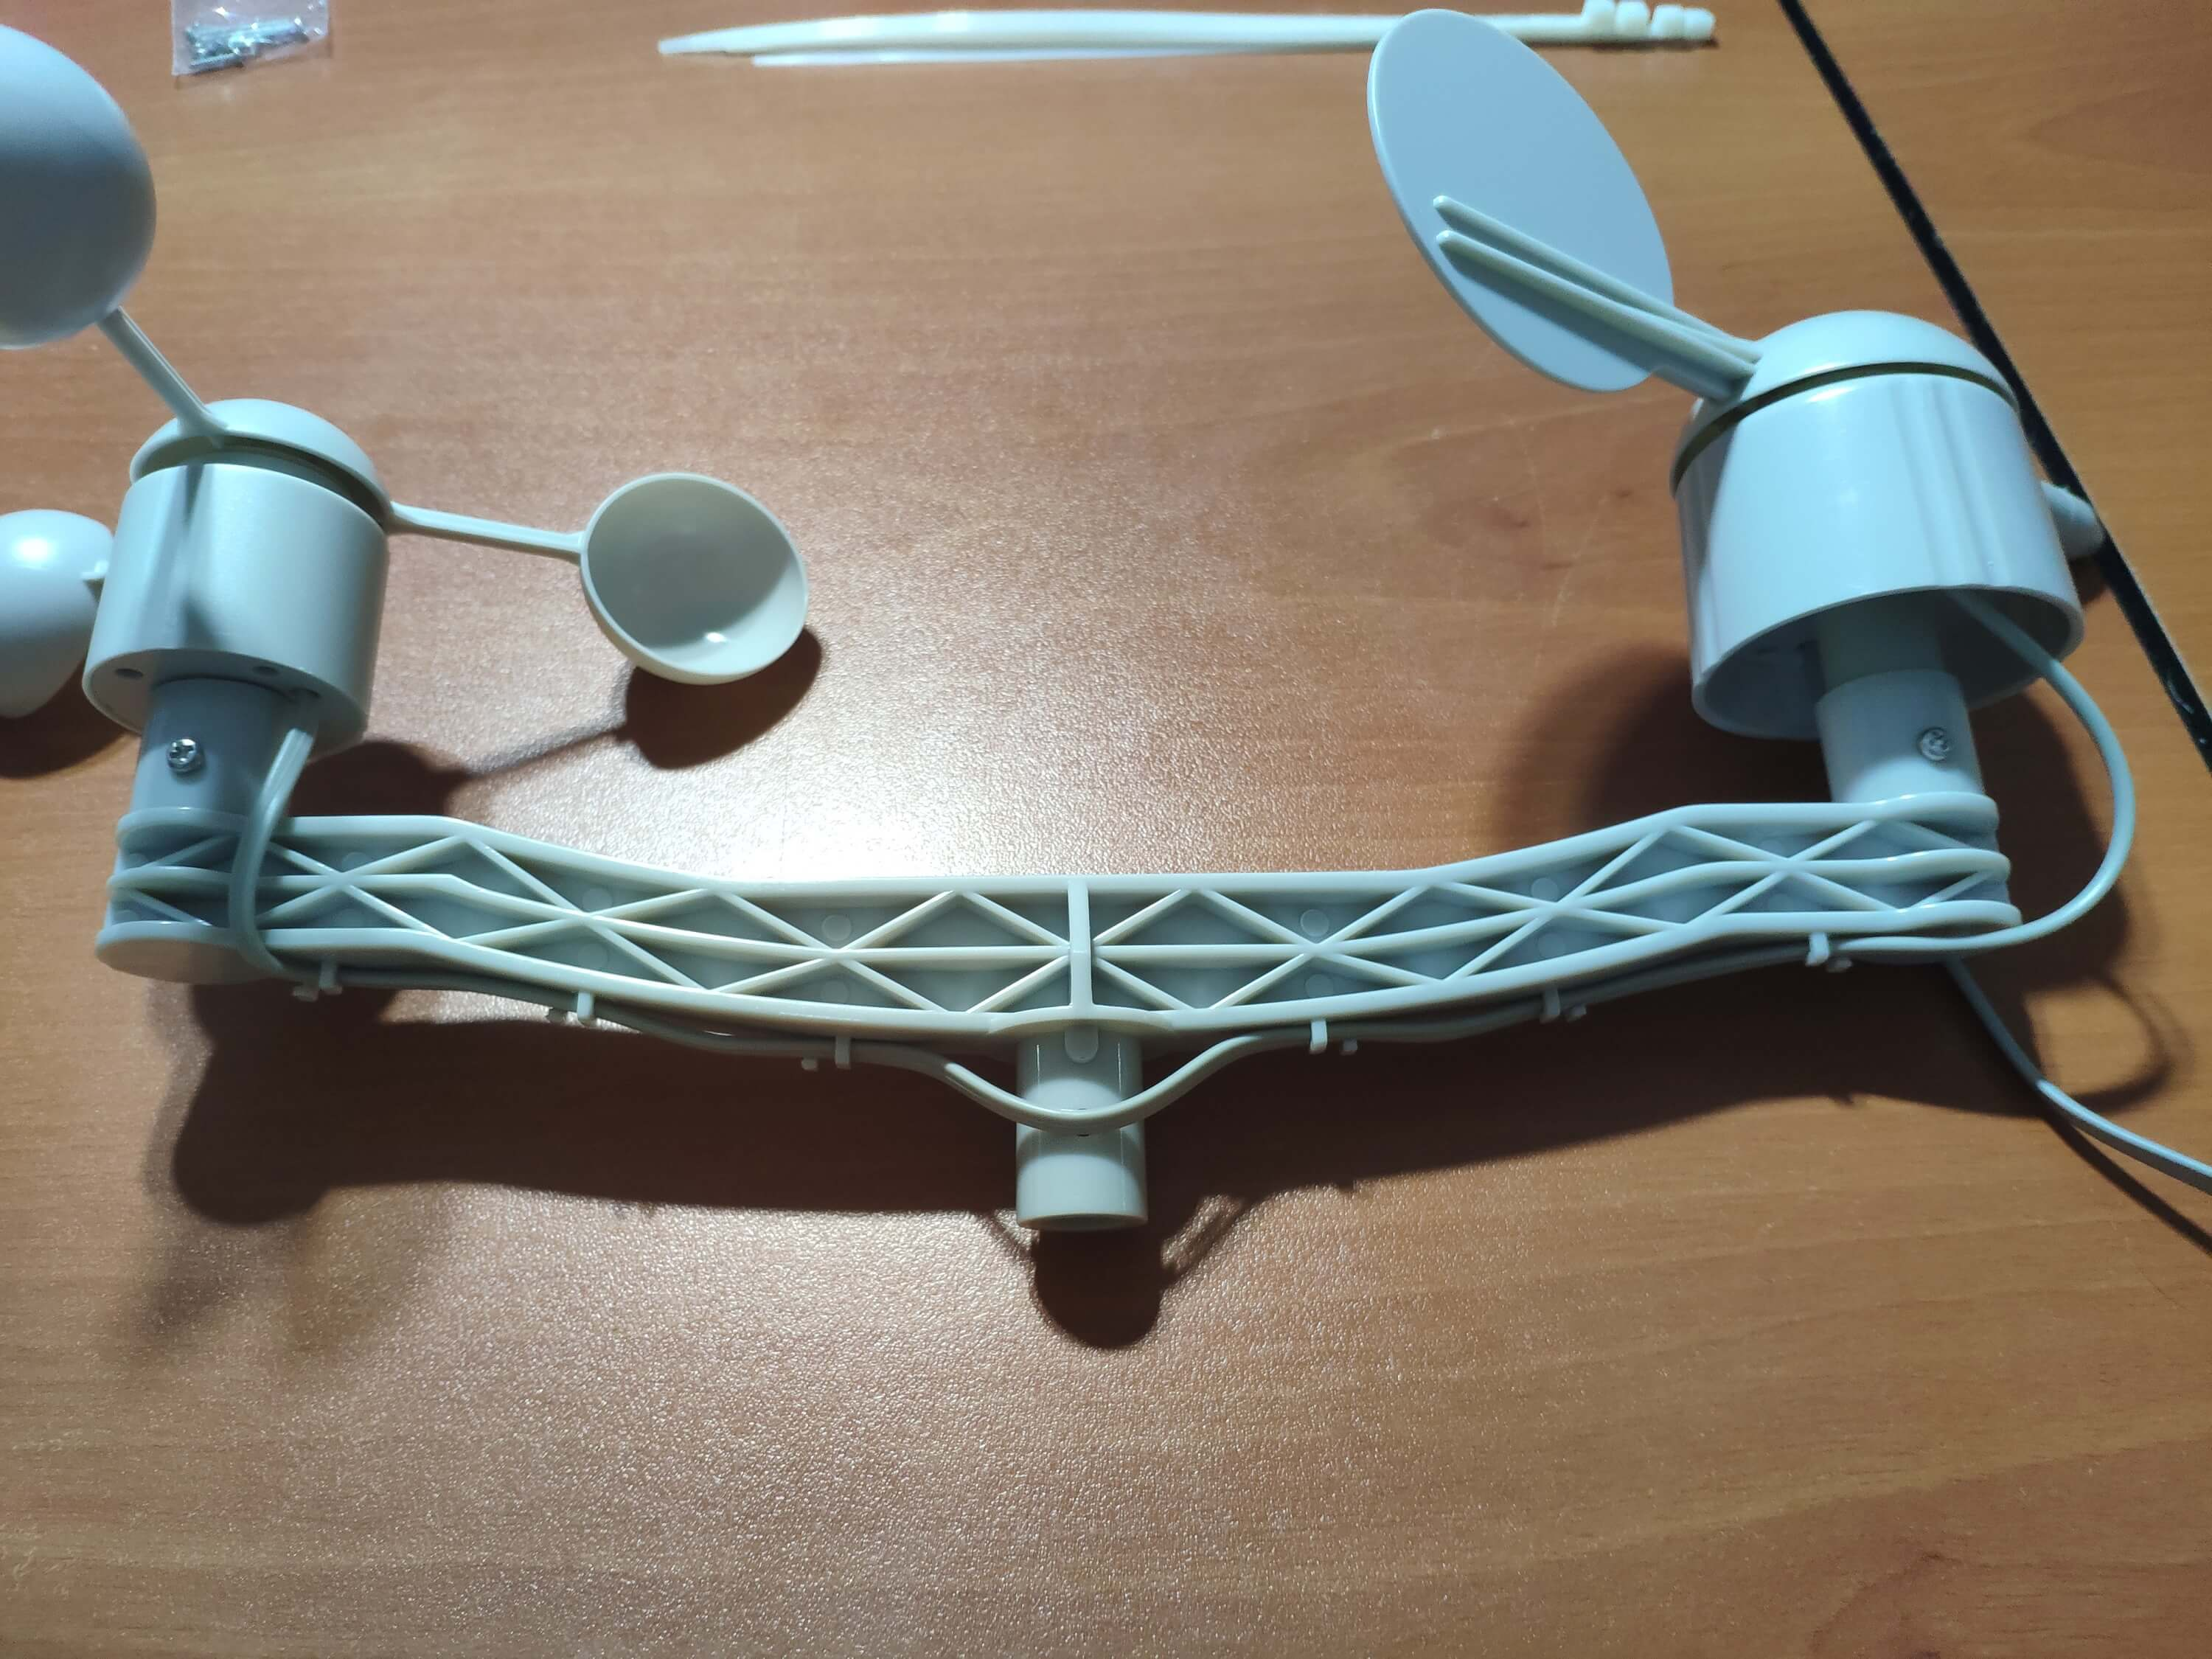
⭐ Затем прикрепите стержень из нержавеющей стали к мосту с помощью винтов.
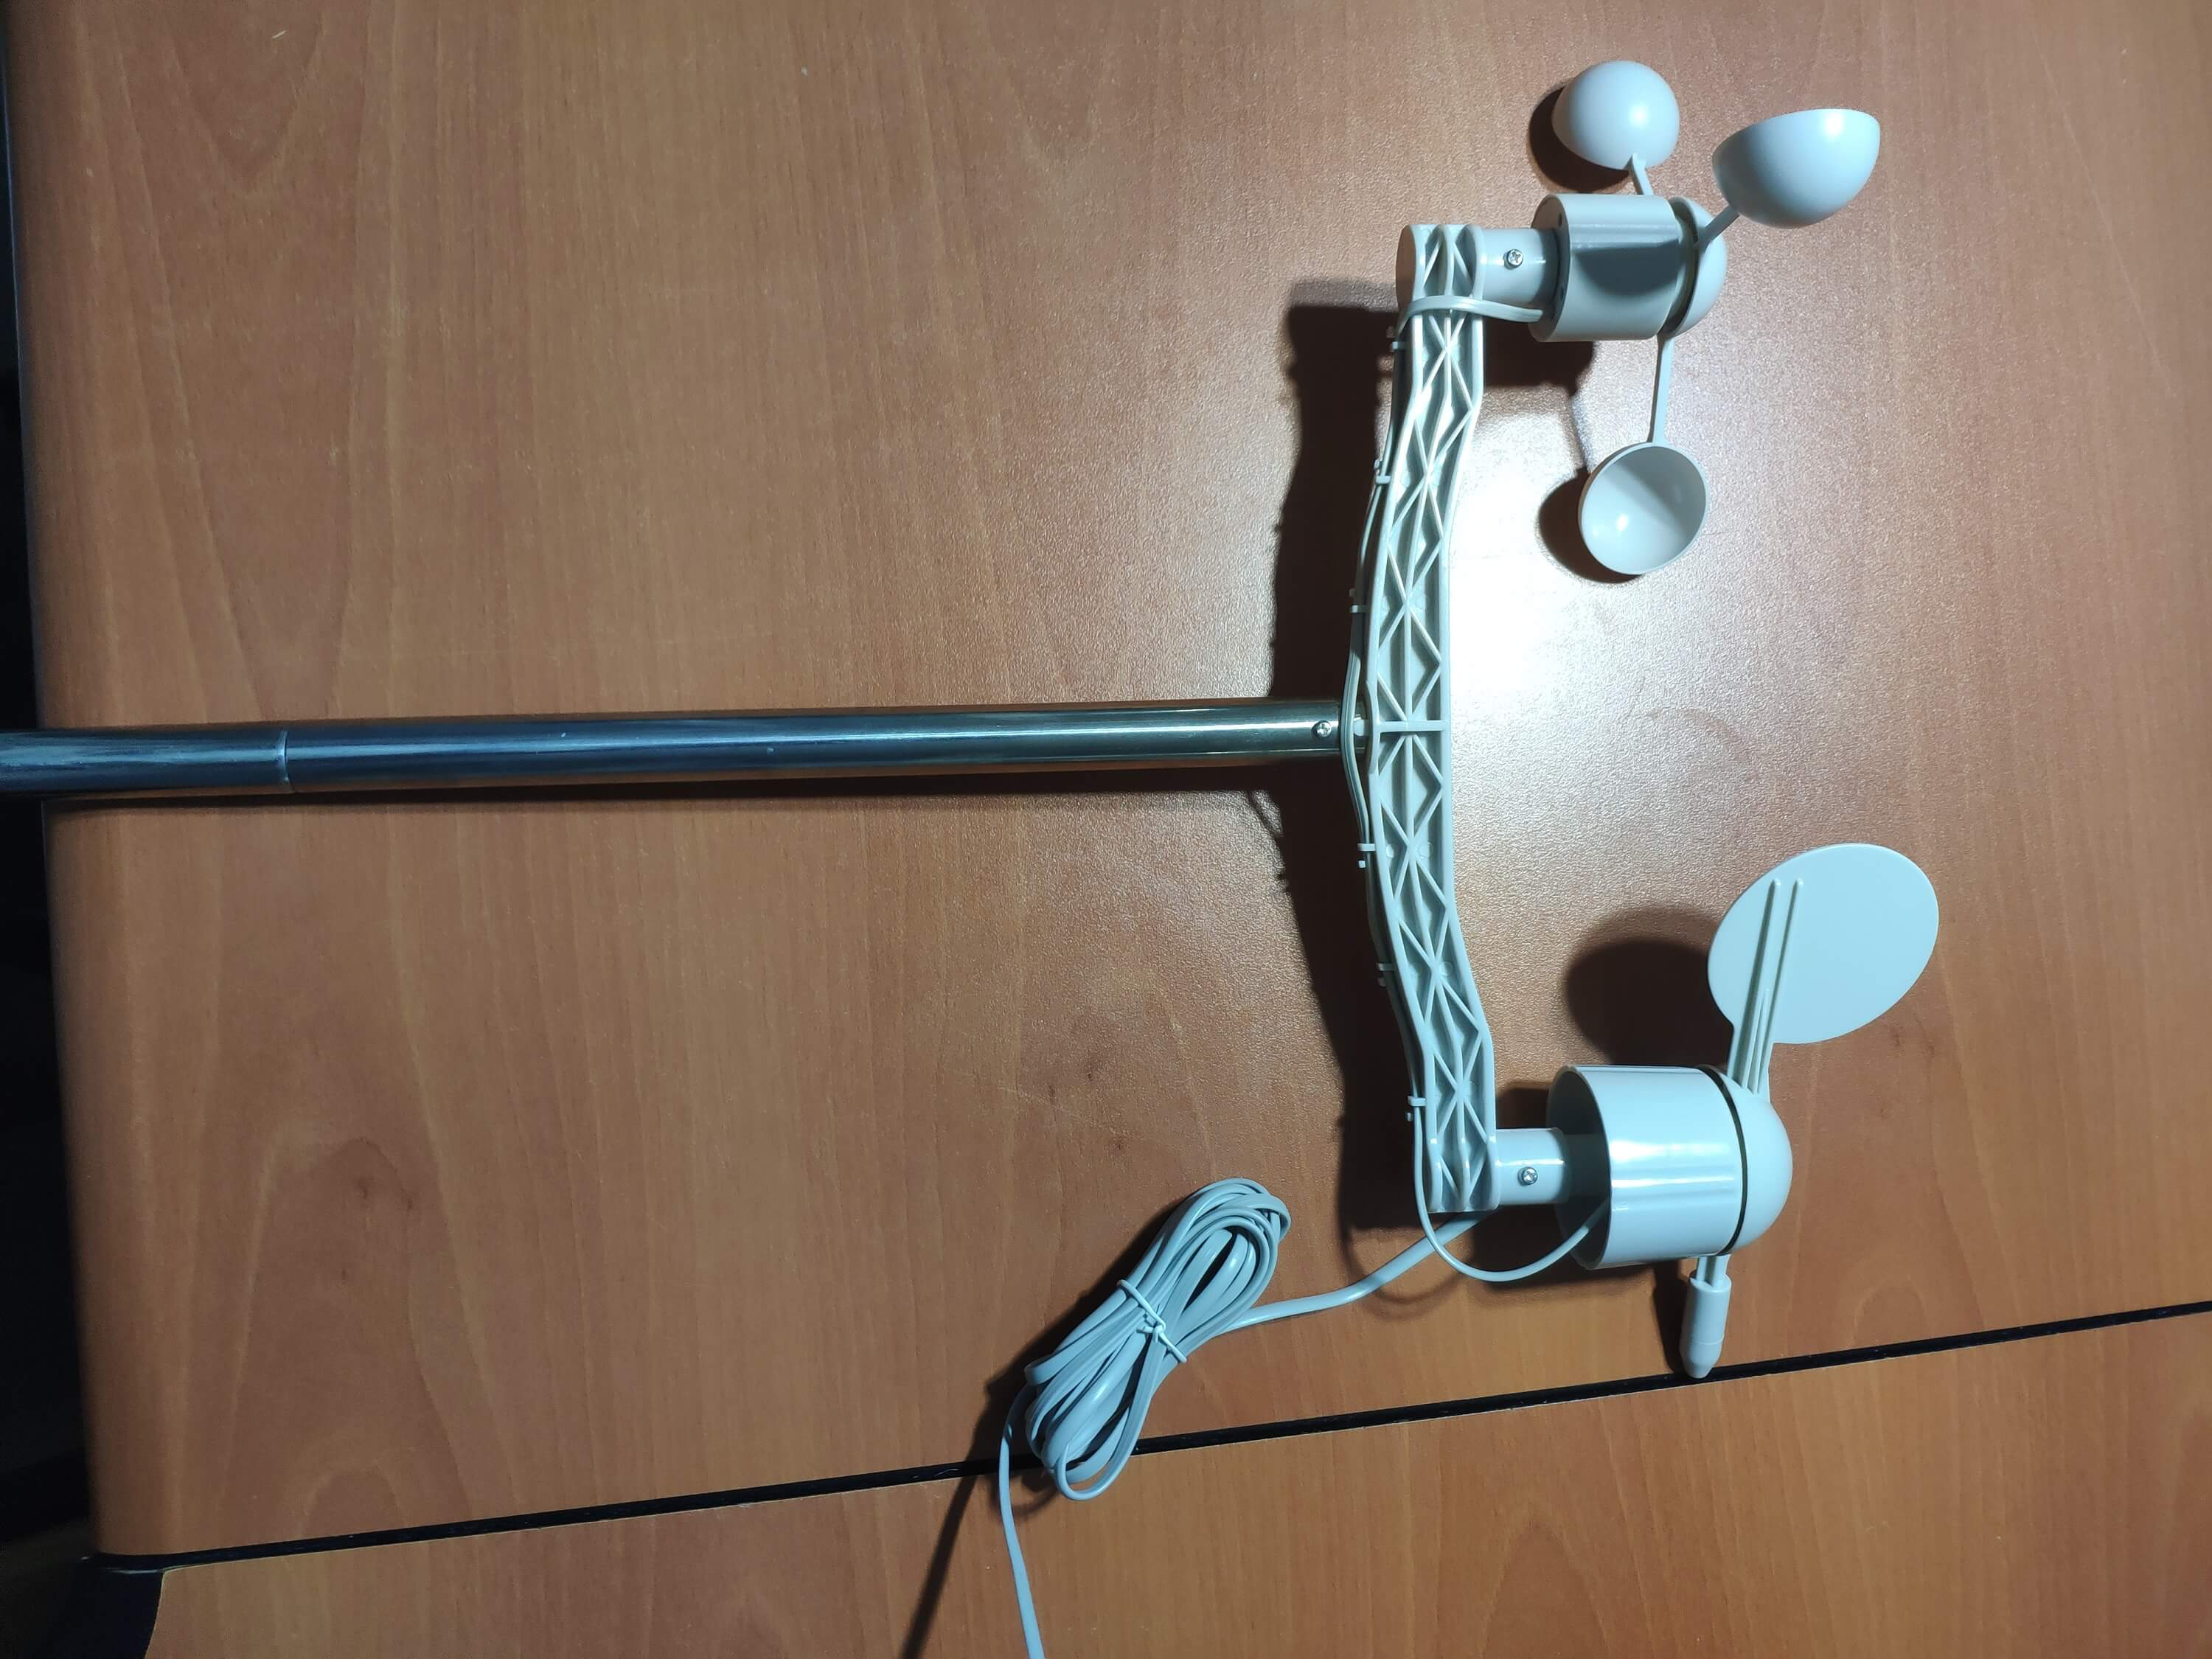
⭐ Закрепите шарнир ковша для дождя под ковшом с помощью винтов.
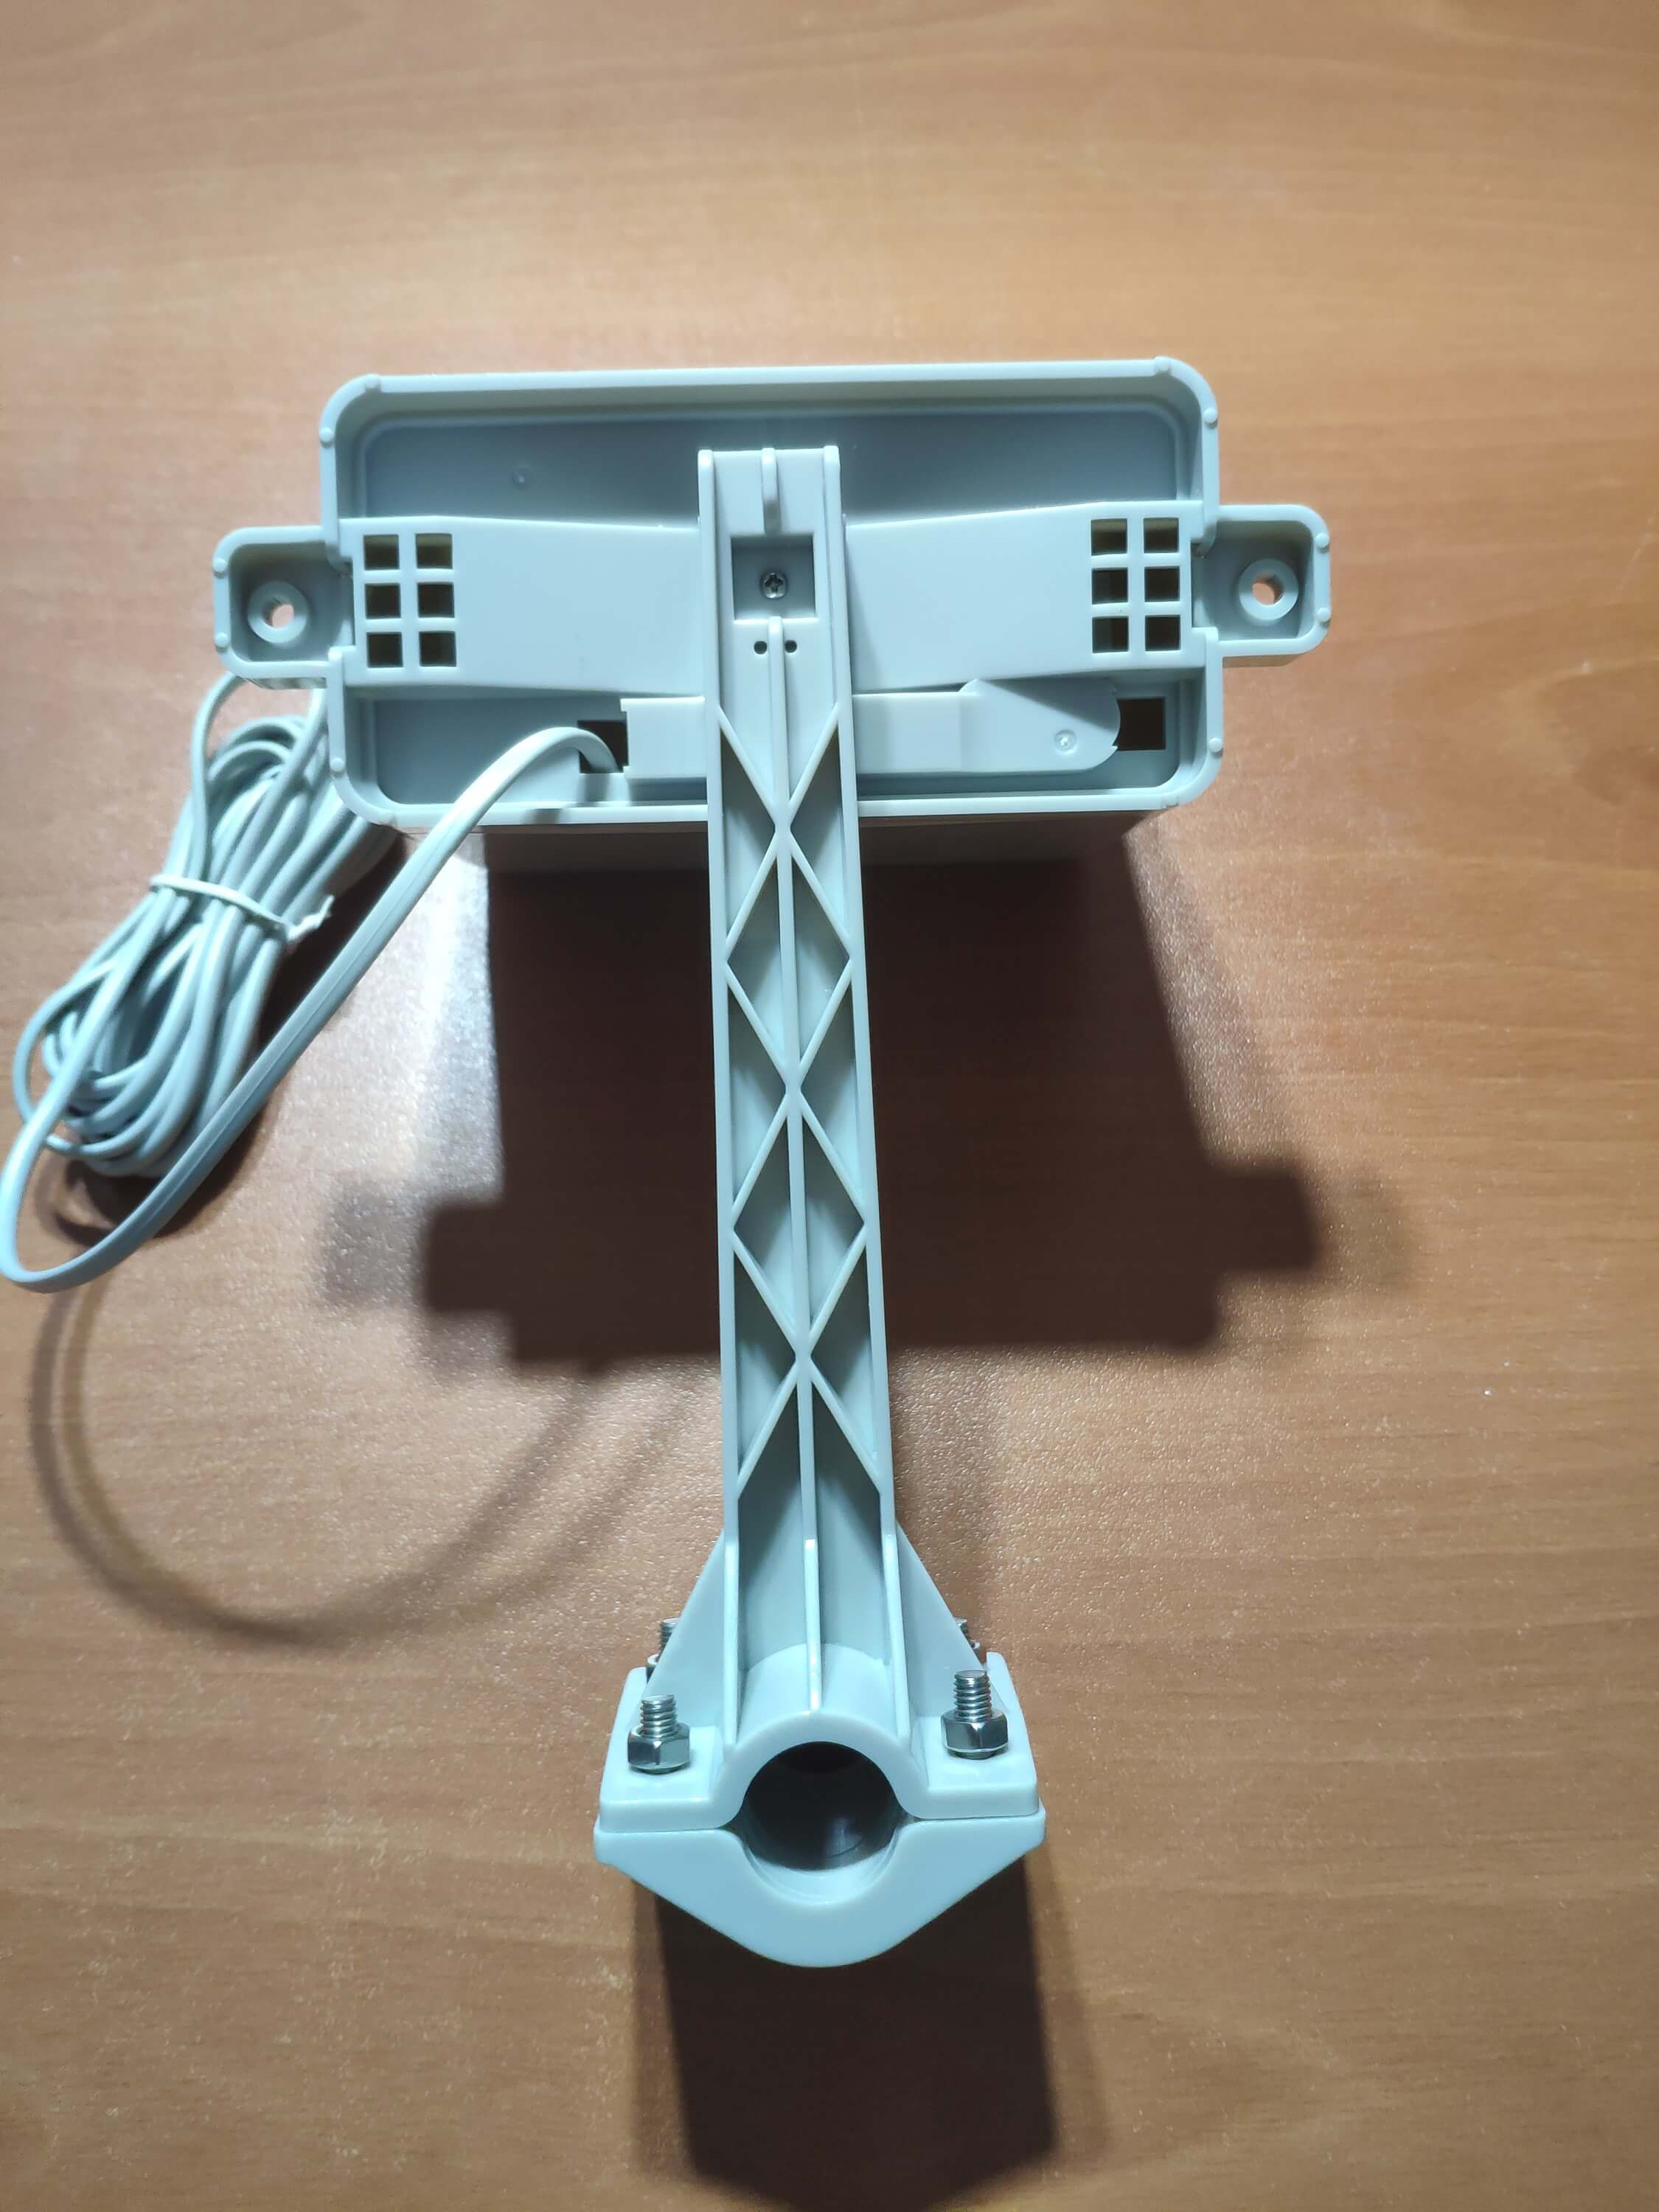
⭐ Наконец, установите ведро для дождя на стержень из нержавеющей стали с помощью винтов и гаек.
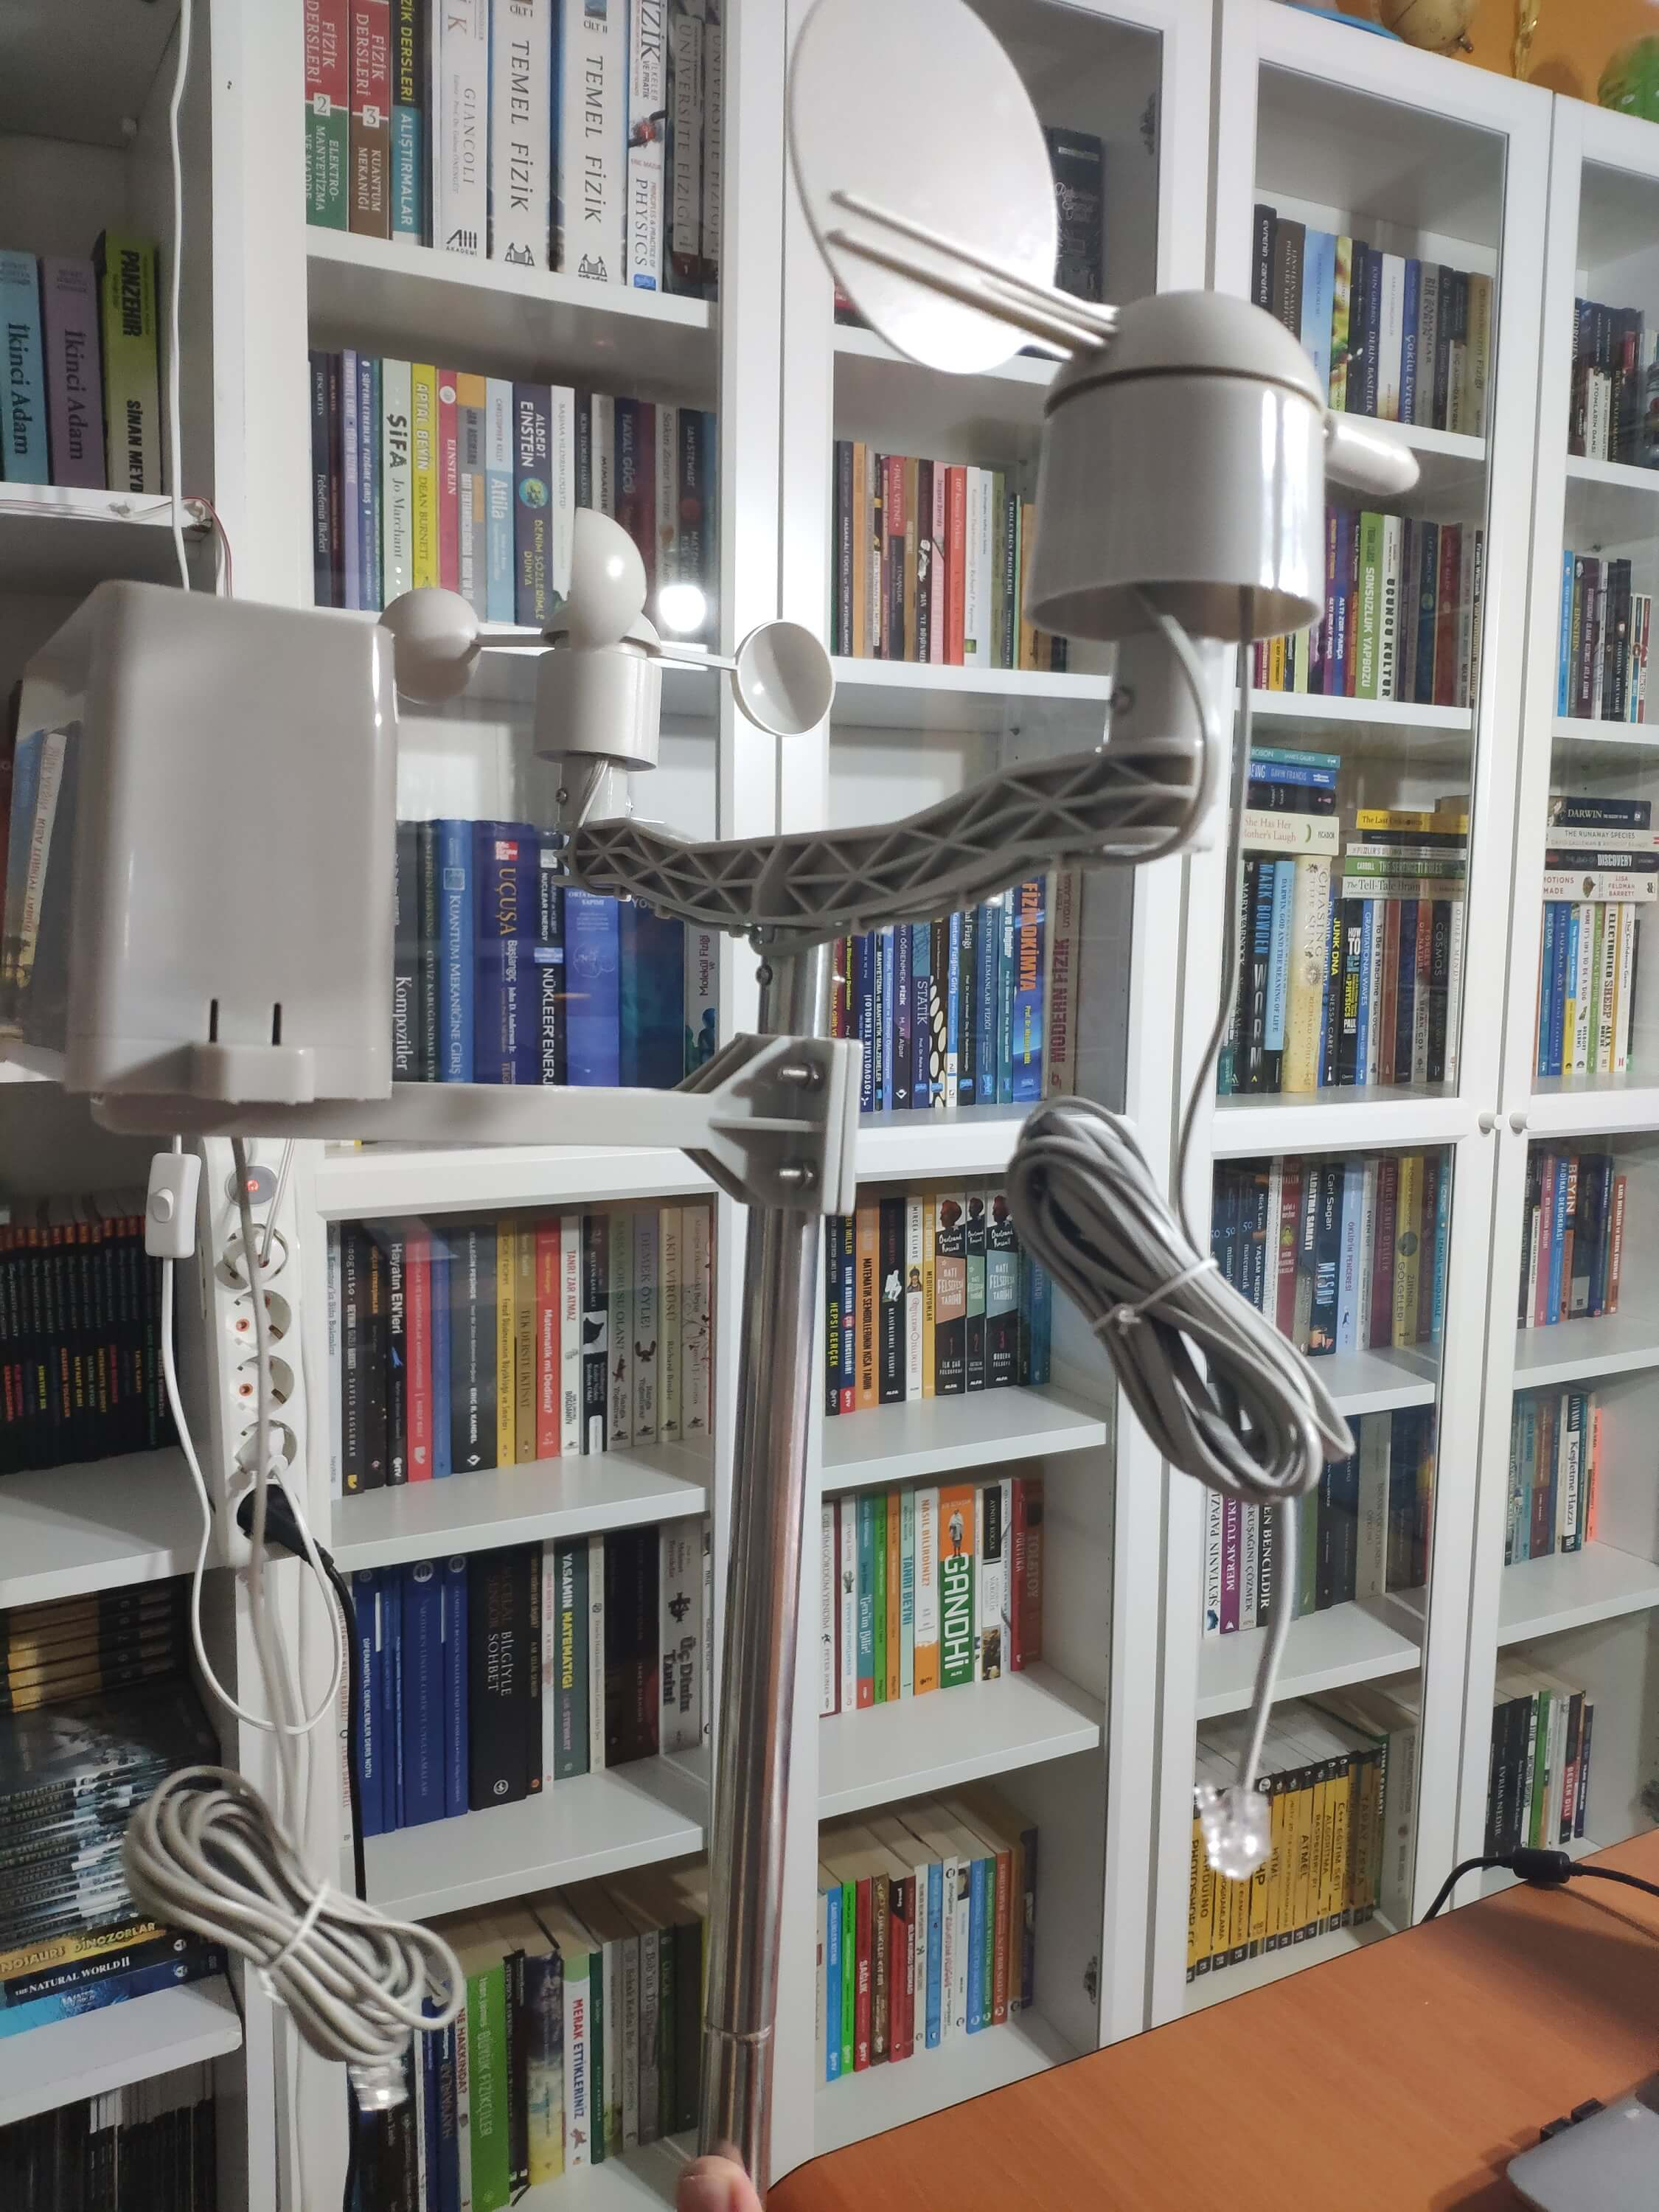
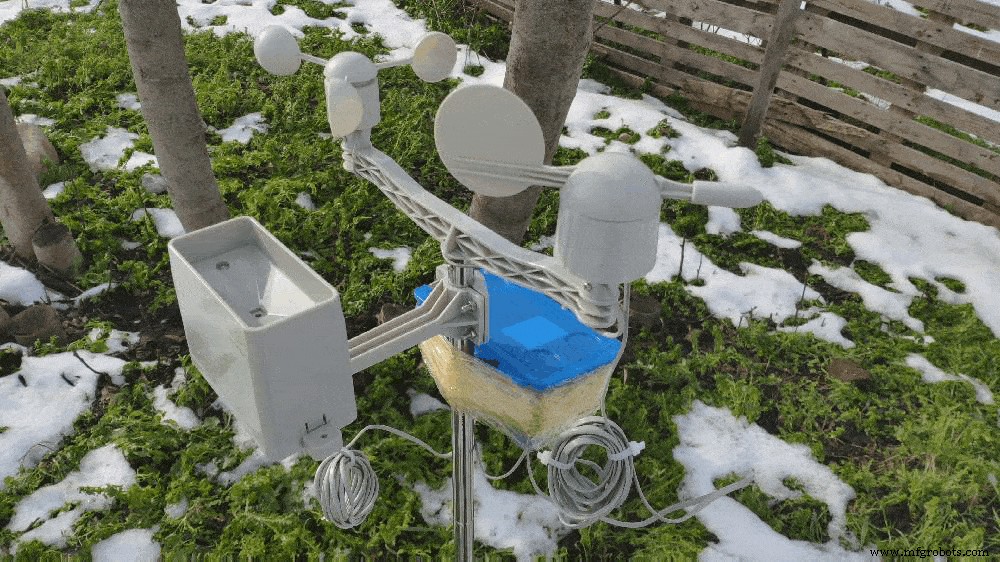
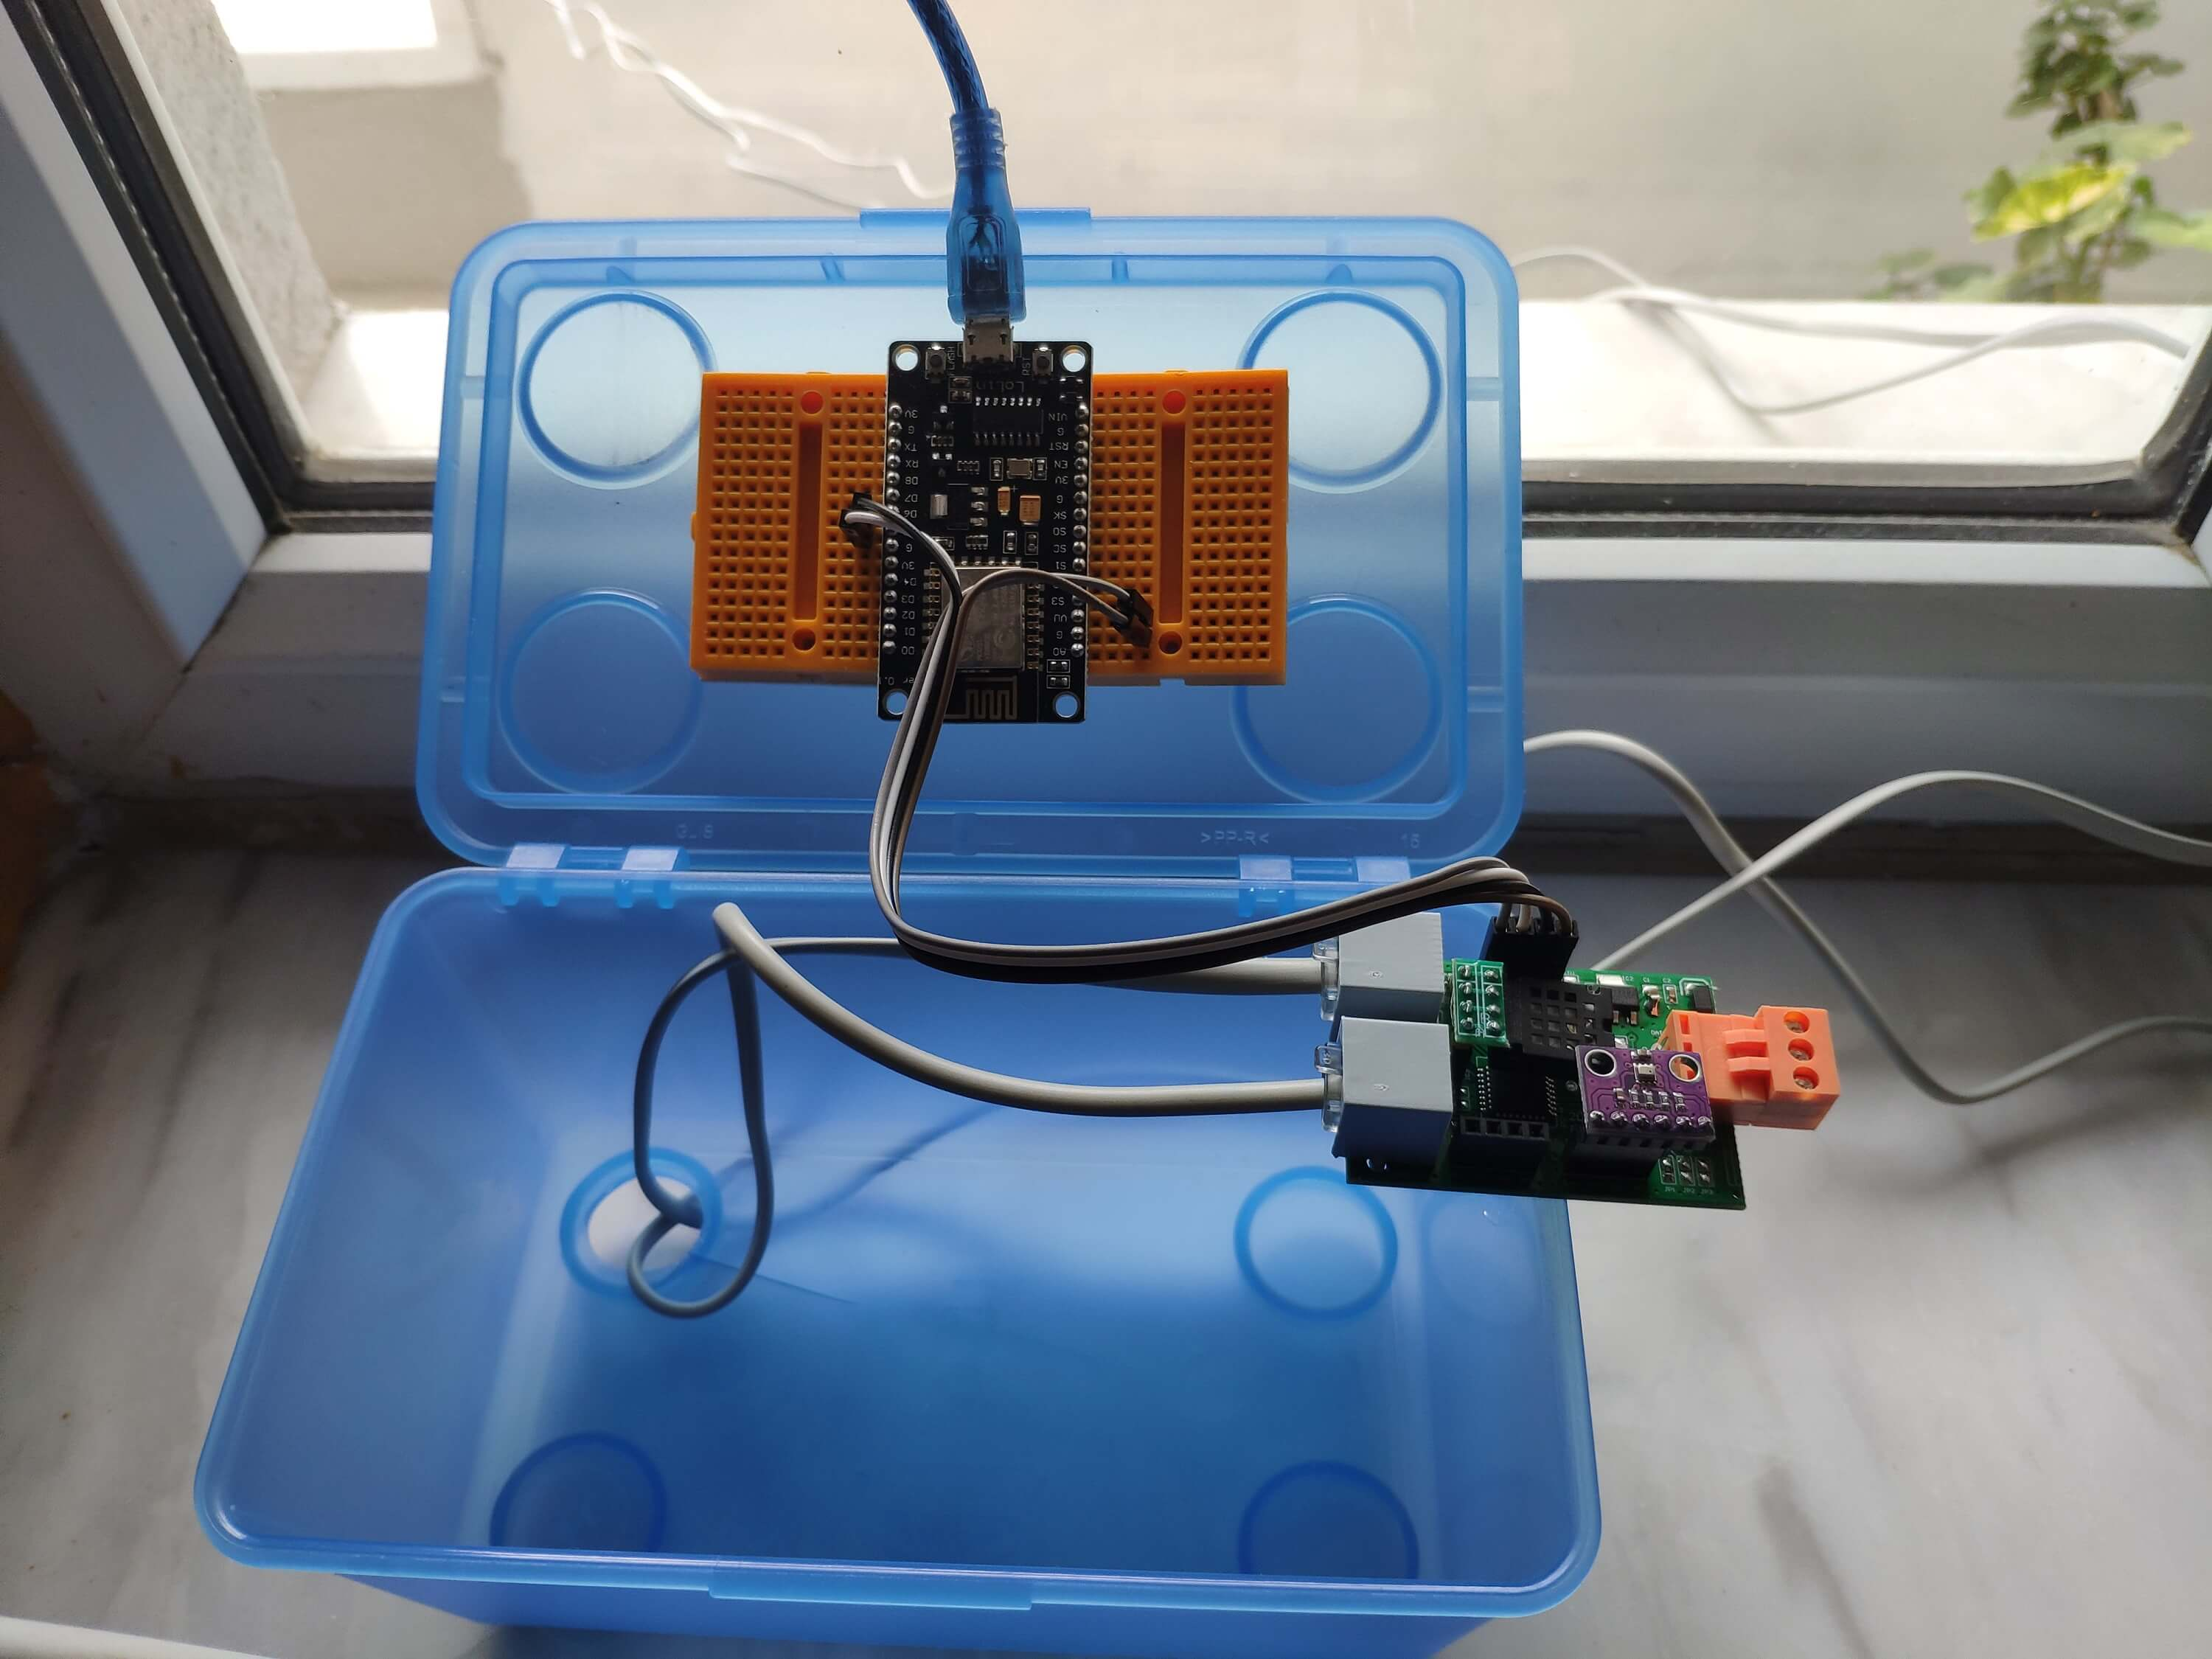
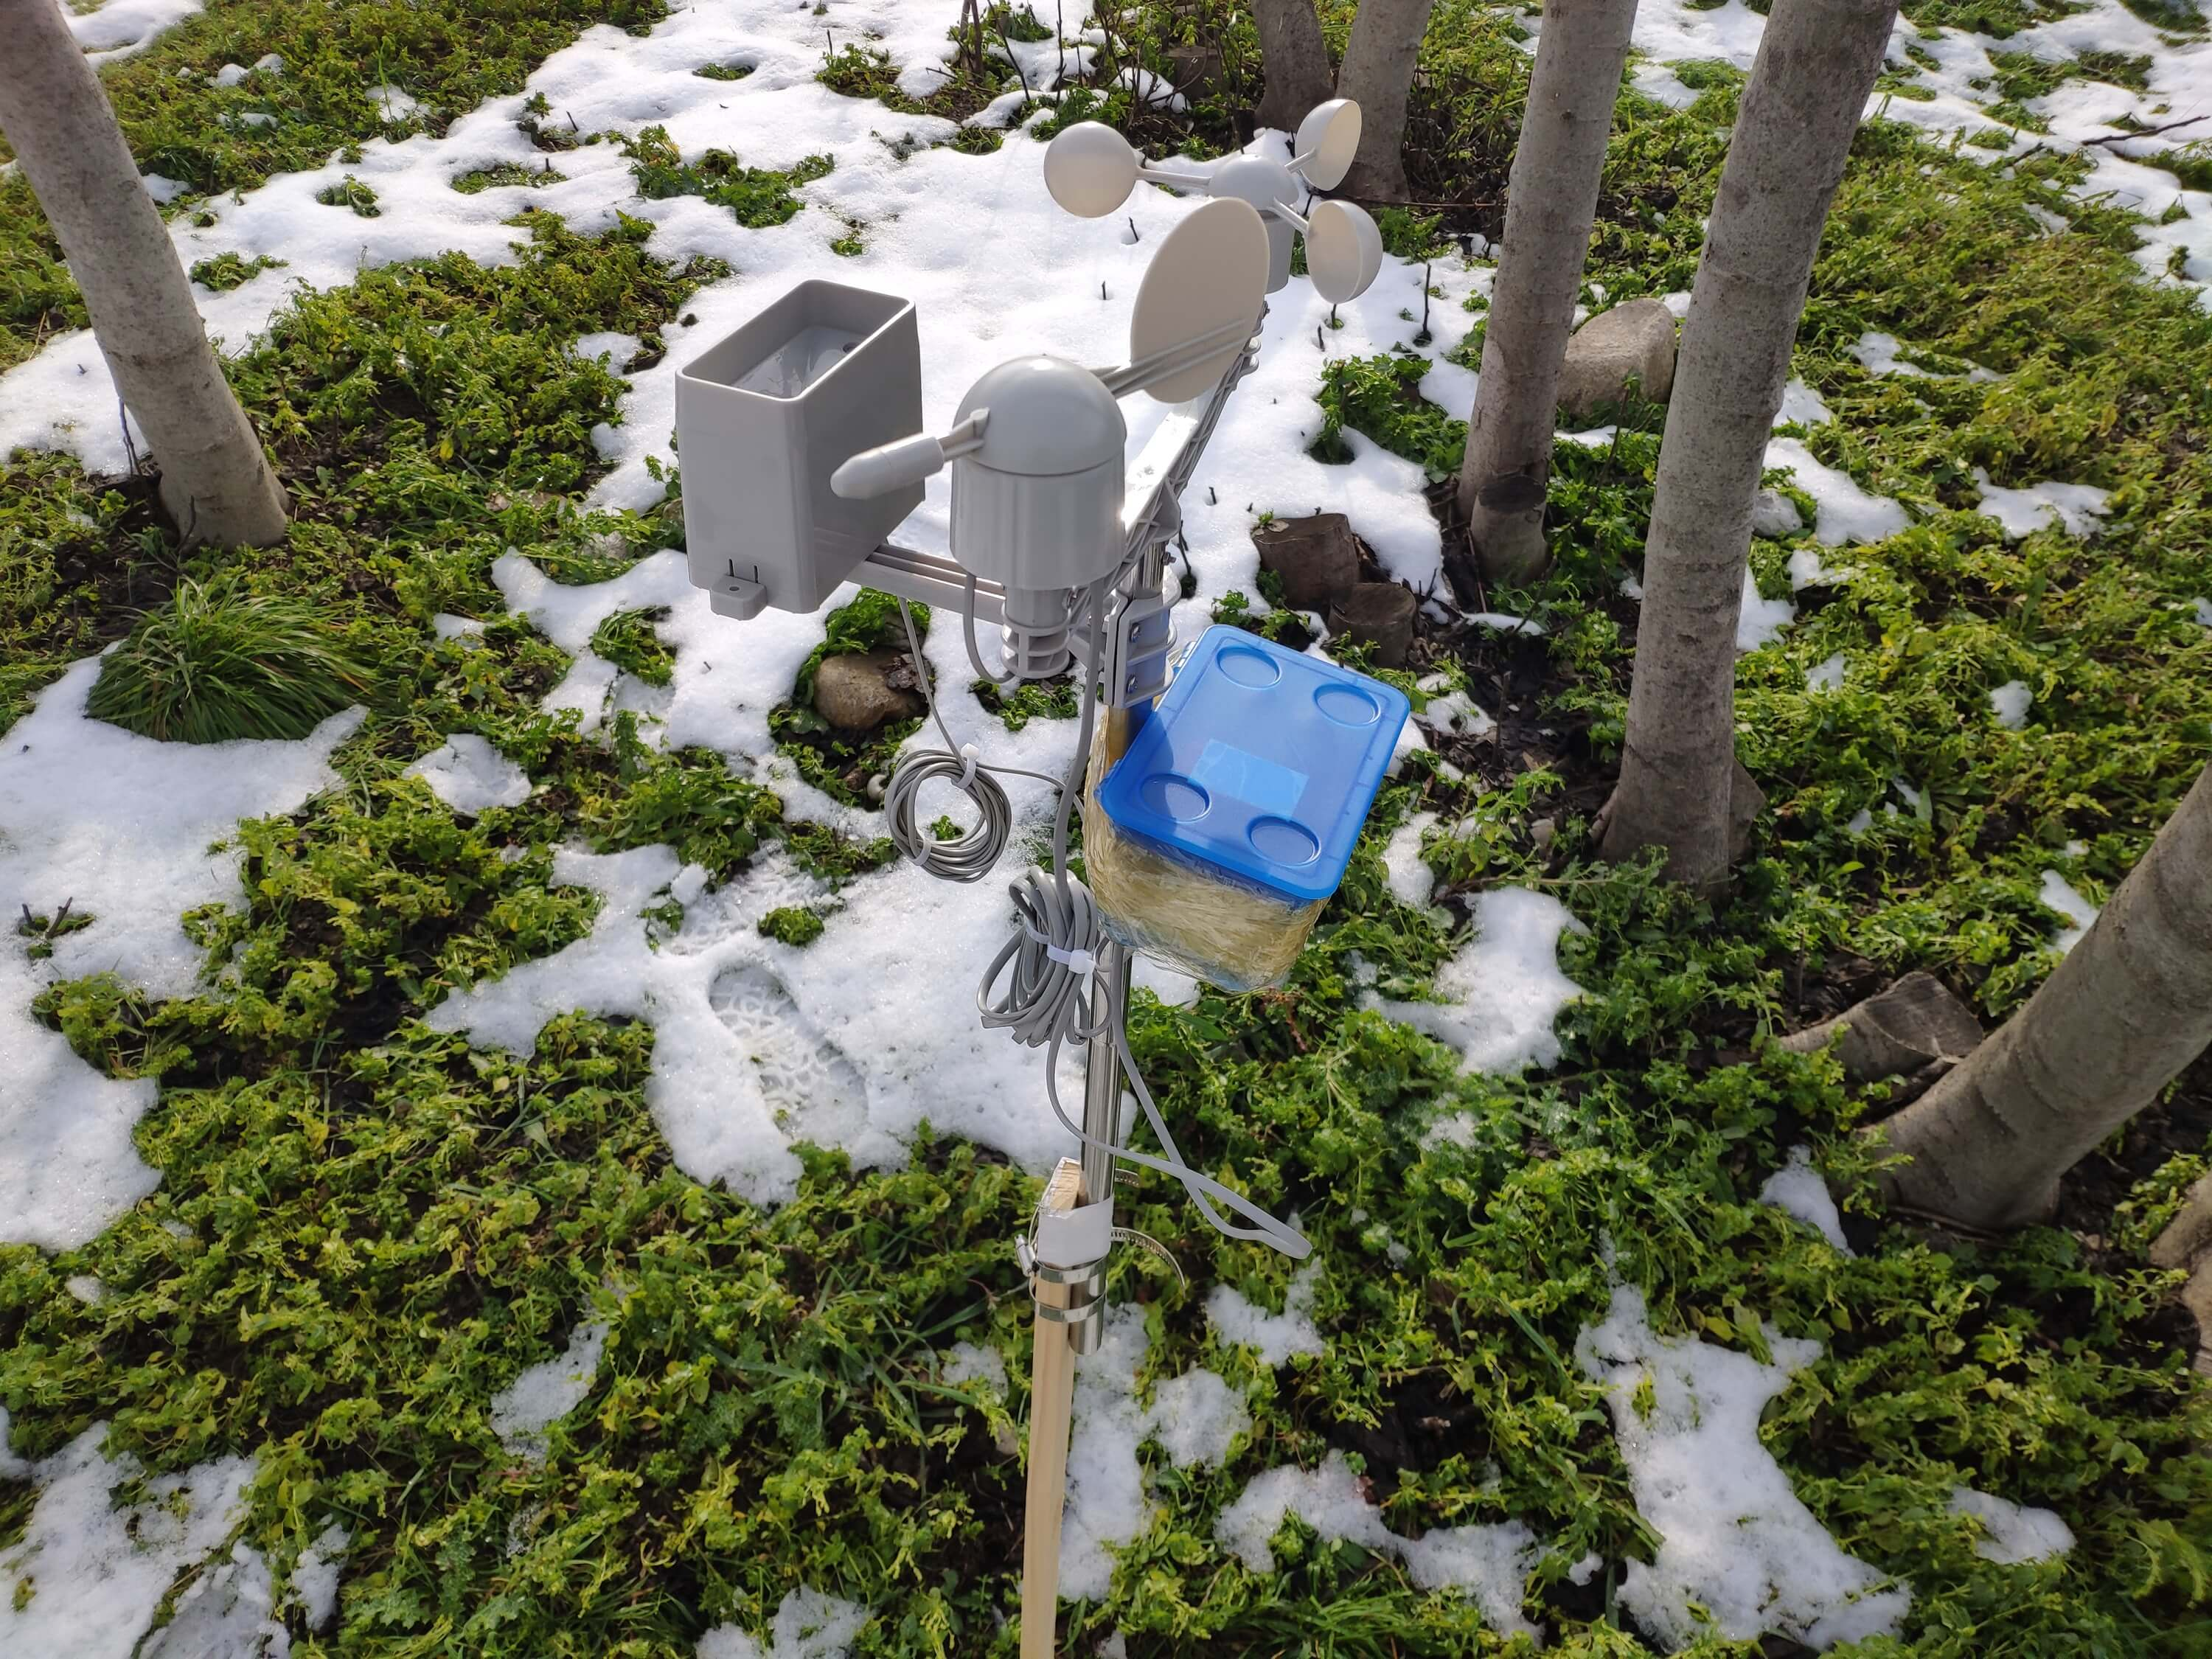
⭐ Теперь он готов собирать данные о погоде даже в экстремальных погодных условиях. Однако плата датчика (преобразователя) не является водонепроницаемой, поэтому я добавил пластиковую коробку к метеостанции, чтобы защитить плату датчика и экран SIM808 на открытом воздухе.
Шаг 2. Сбор данных о погоде в Google Таблицах
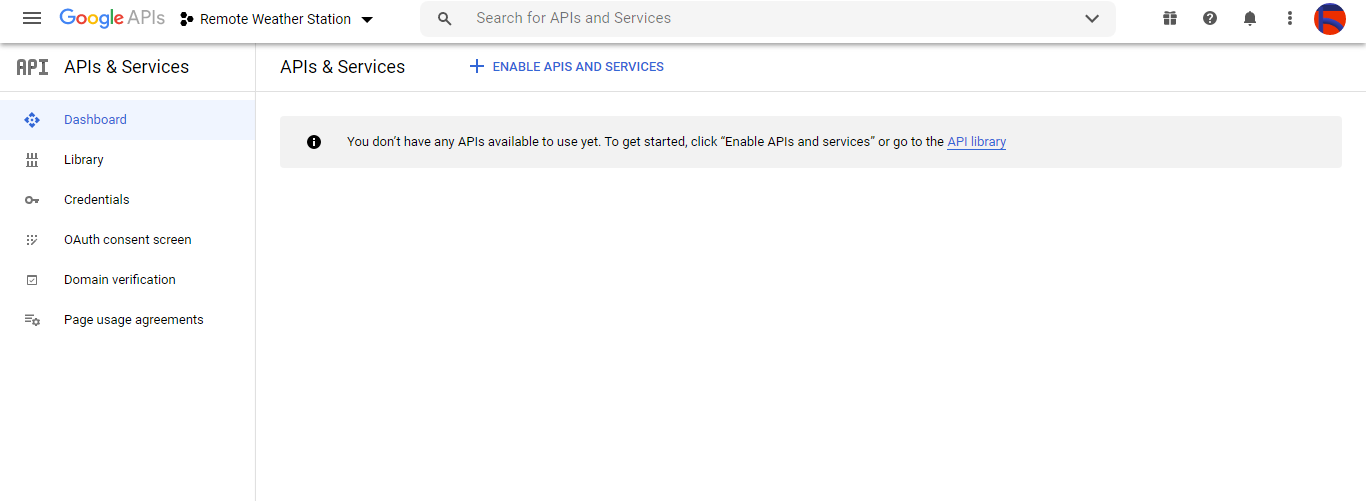
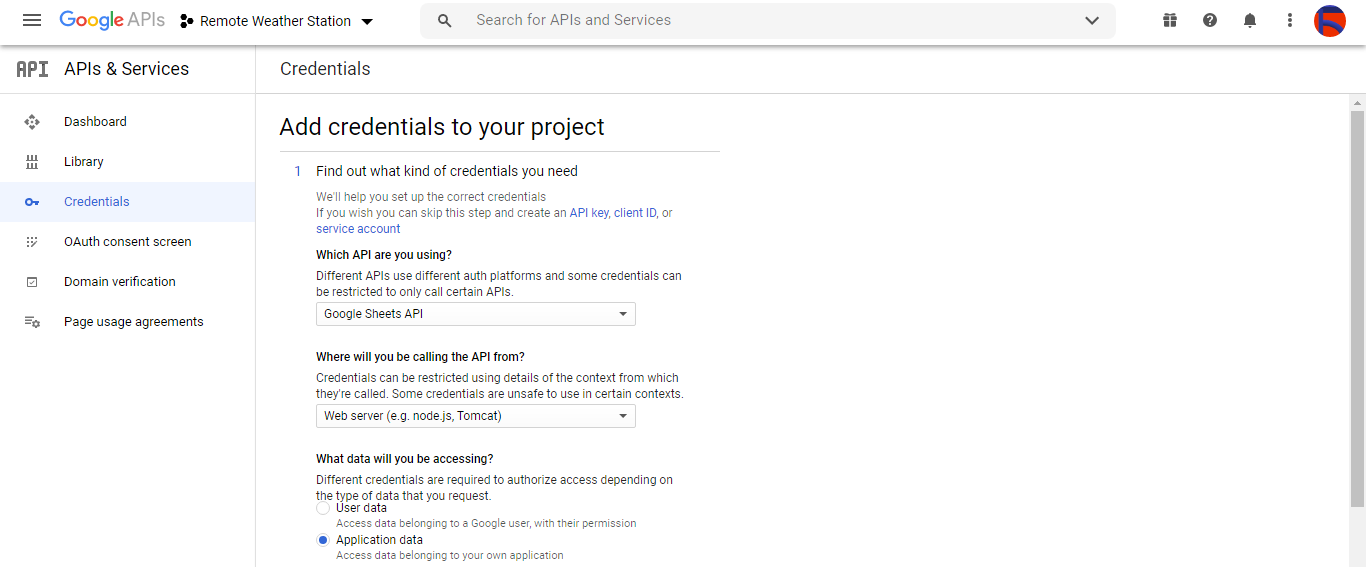
Чтобы иметь возможность отправлять информацию в электронную таблицу в Google Sheets, вам необходимо создать новое приложение в консоли разработчика Google и получить учетные данные для использования Google Sheets API. Если вы новичок в создании приложений с помощью консоли разработчика Google, следуйте приведенным ниже инструкциям.
⭐ Перейдите в консоль разработчика Google и нажмите кнопку «НОВЫЙ ПРОЕКТ». Введите название проекта как Удаленная метеостанция . .

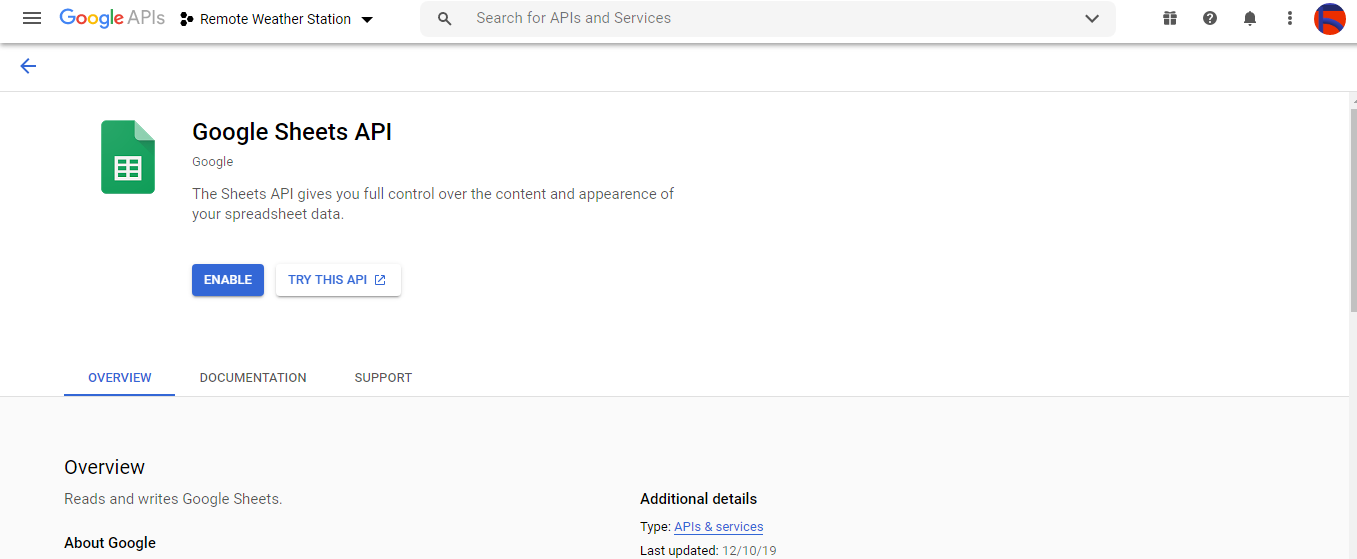
⭐ Перейдите в API и службы и щелкните библиотеку API, чтобы включить API Google Таблиц.
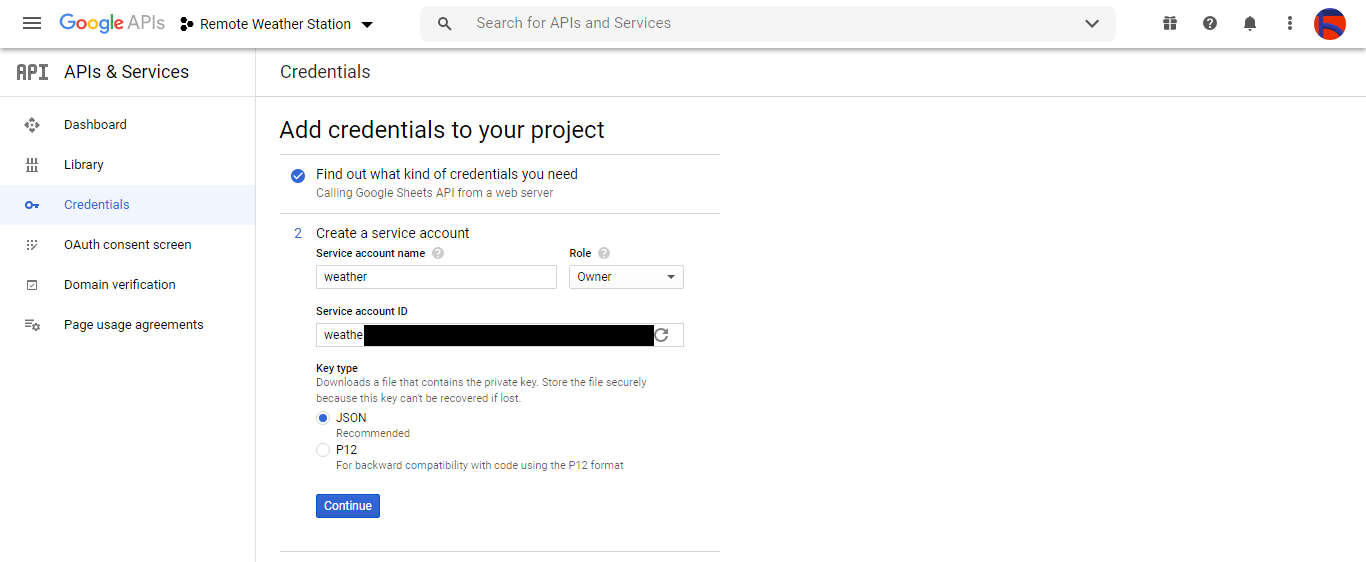
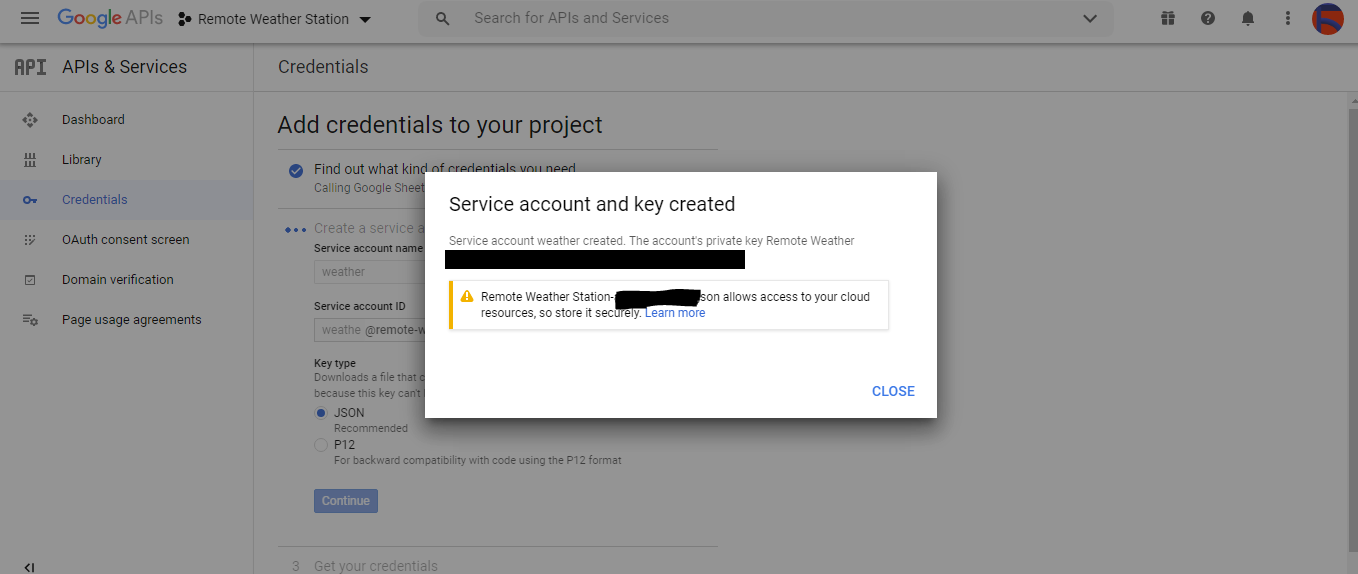
Шаг 2.1:Получение учетных данных для использования API Google Таблиц
⭐ Откройте панель управления проекта и нажмите Учетные данные кнопка. Затем заполните форму, как показано ниже, чтобы создать учетную запись службы и ключ.
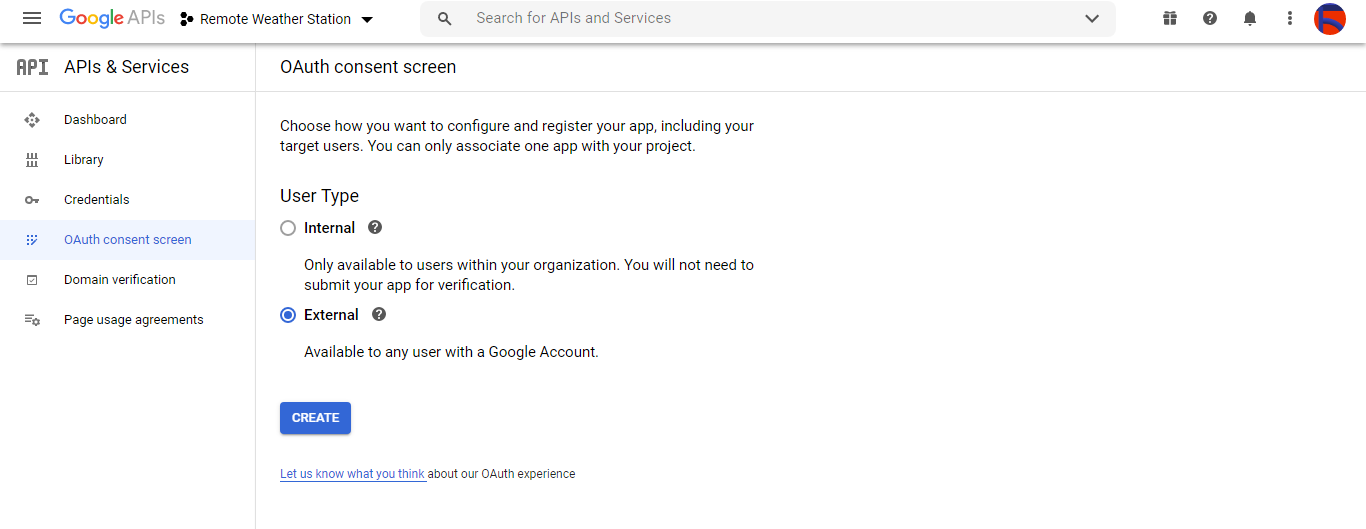
⭐ Нажмите СОЗДАТЬ УЧЕТНЫЕ ДАННЫЕ . и настройте экран согласия, чтобы можно было создать идентификатор клиента OAuth.
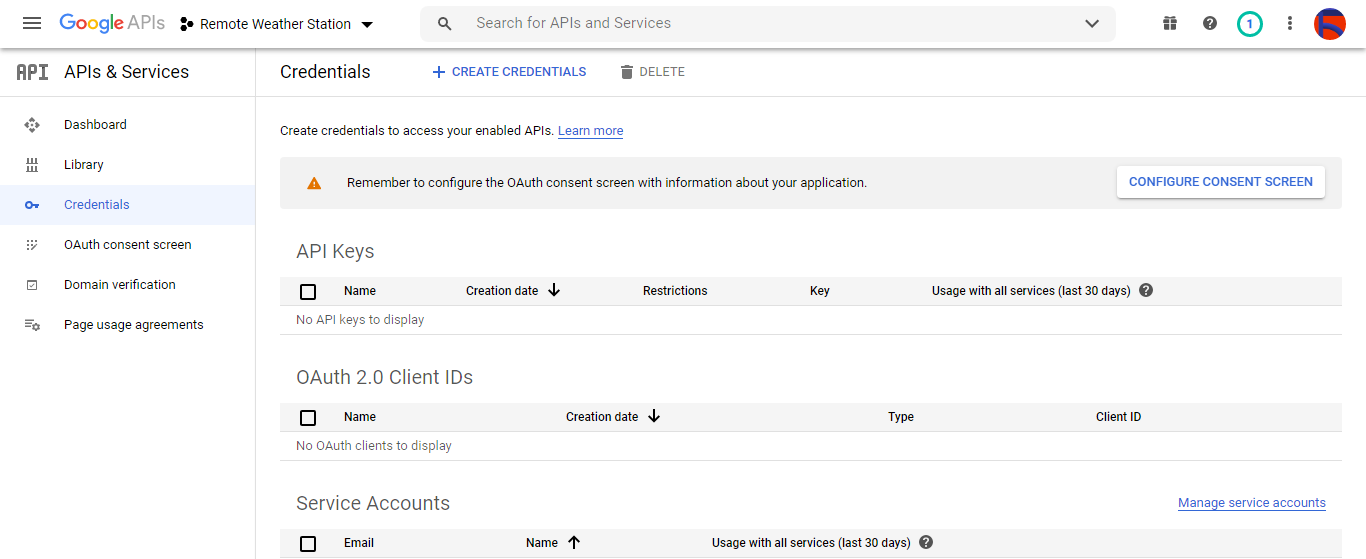
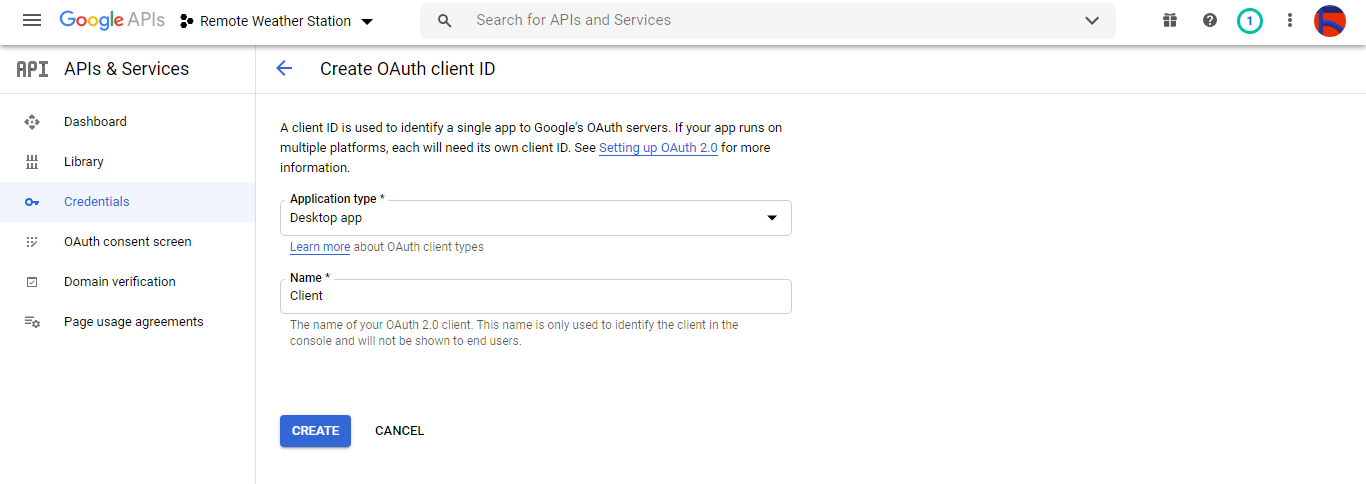
⭐ Затем создайте новый идентификатор клиента OAuth с именем Client . в разделе Настольное приложение (тип приложения).
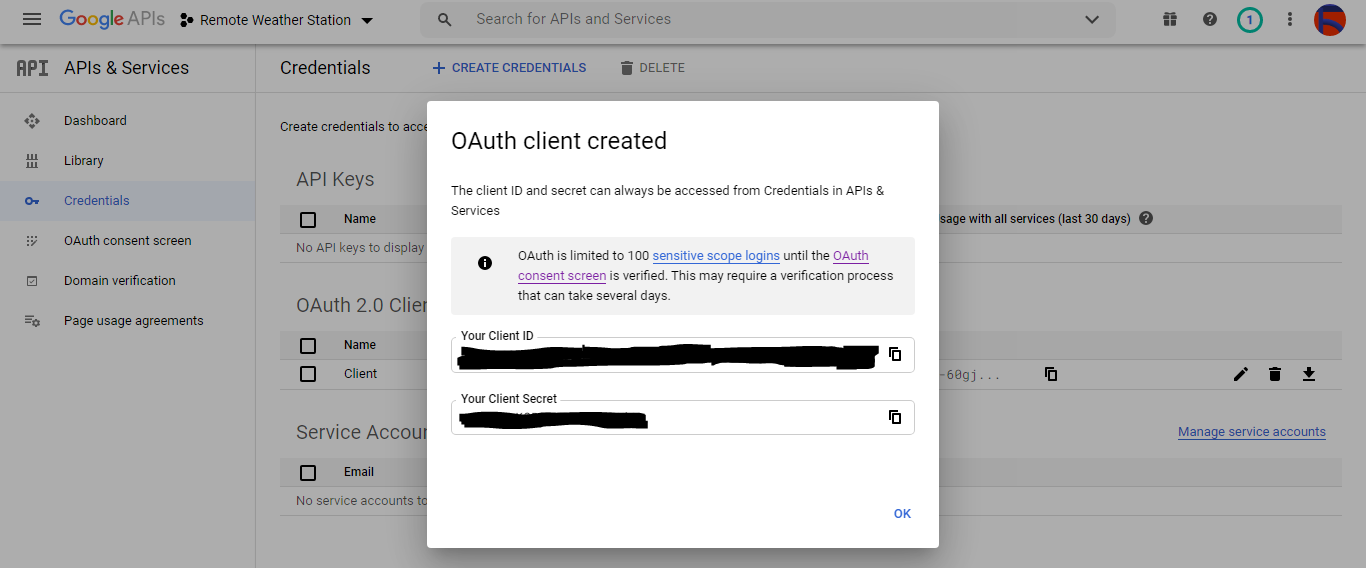
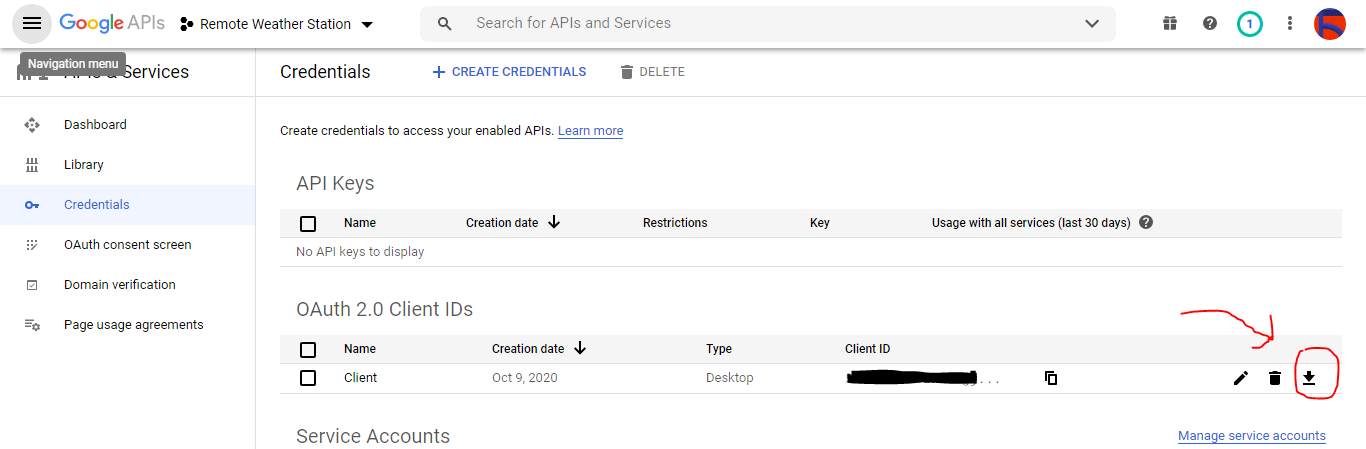
⭐ После создания идентификатора клиента OAuth (Клиент) загрузите учетные данные (идентификатор и секрет) и назовите файл credentials.json .
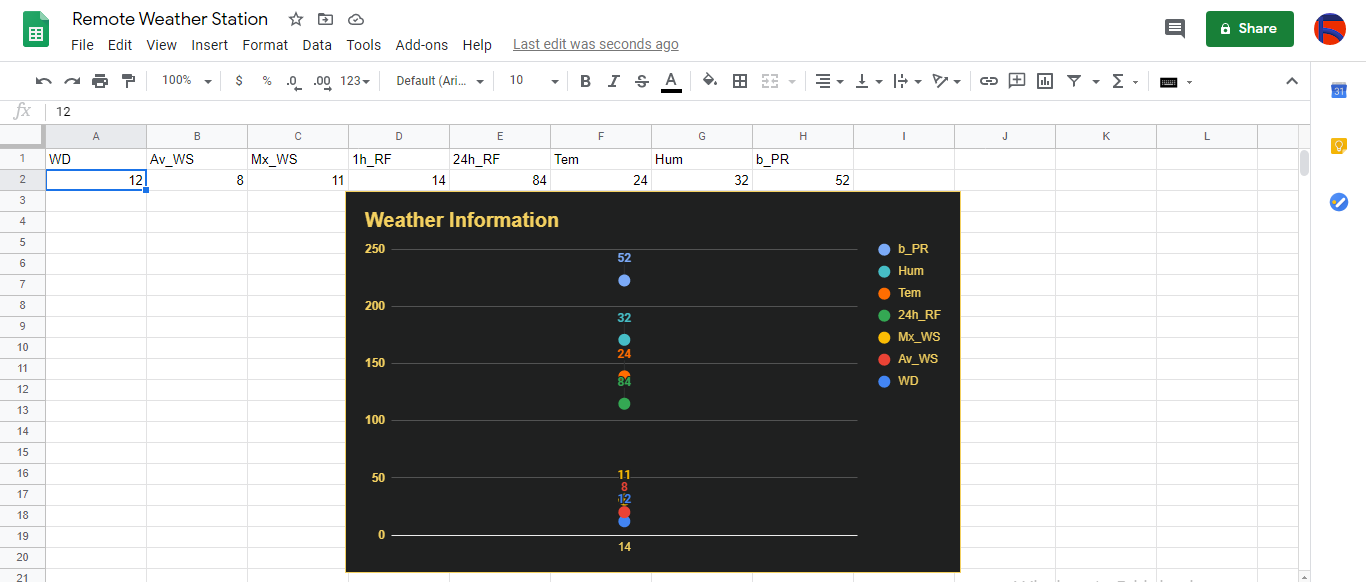
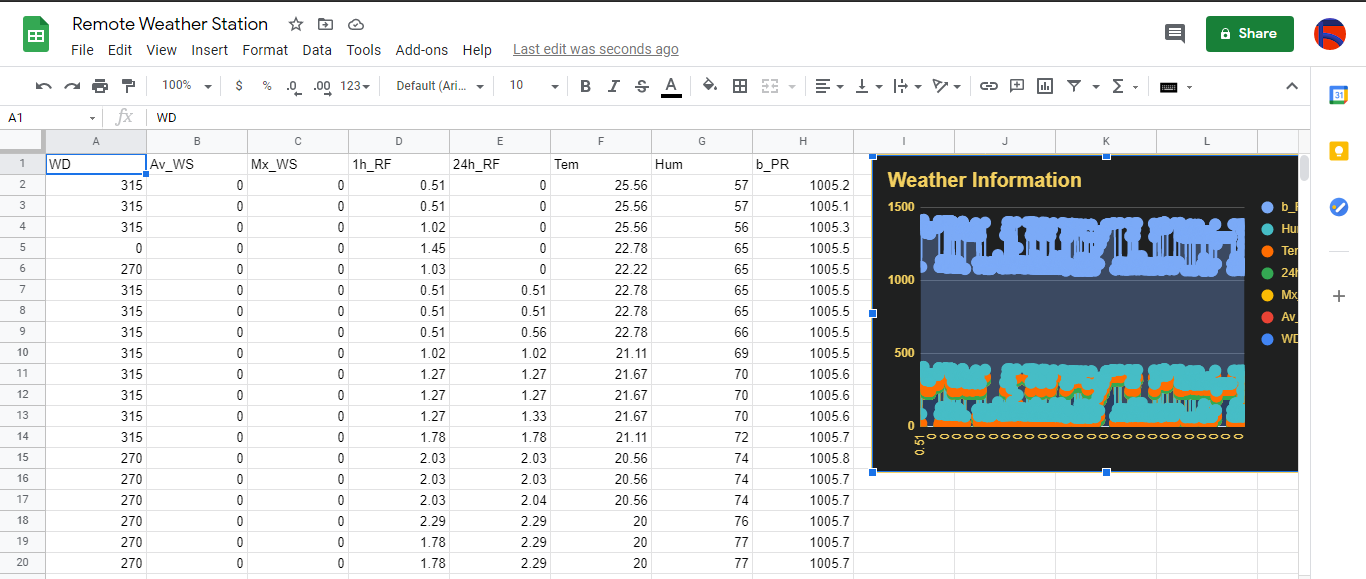
Шаг 2.2:Создание электронной таблицы в Google Таблицах
⭐ Перейдите в Google Таблицы и выберите Личное . .

⭐ Создайте Пустой таблицу и назовите ее Удаленная метеостанция .
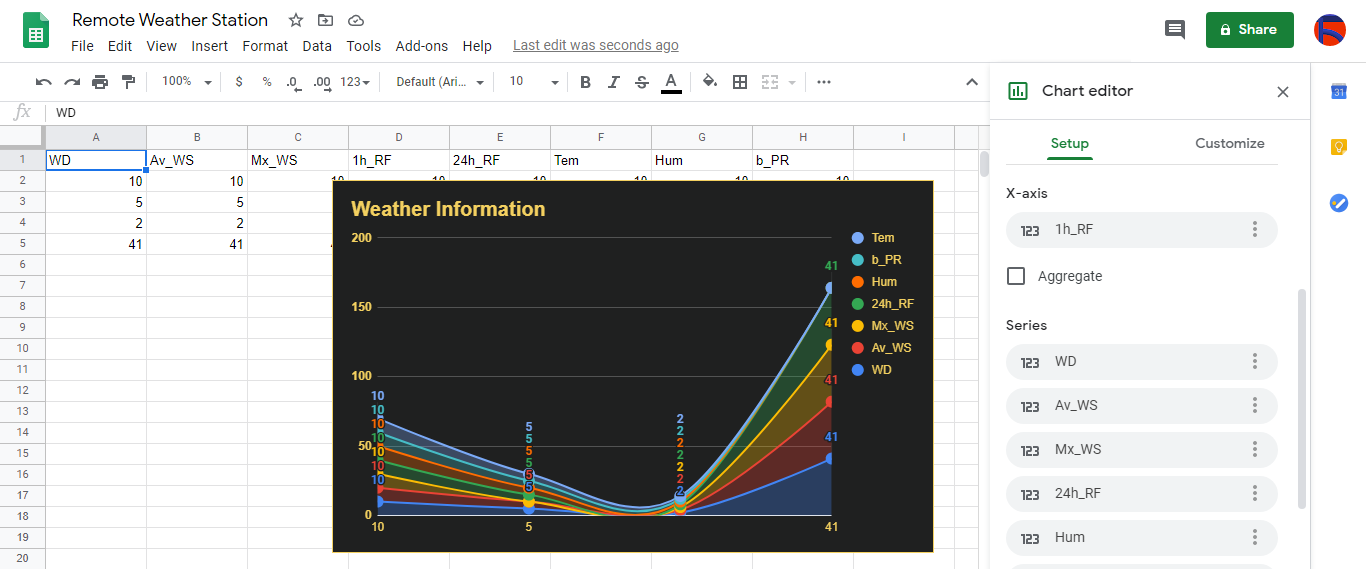
⭐ Затем определите имена столбцов как первую строку:
- WD
- Av_WS
- Mx_WS
- 1ч_РФ
- 24ч_РФ
- Тем
- Гм
- b_PR
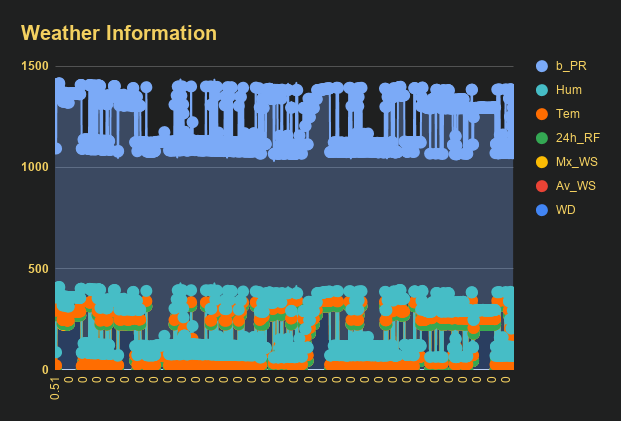
⭐ При необходимости измените диаграмму, чтобы проверить собранные данные, как и я.
Шаг 3. Разработка веб-приложения на PHP для добавления данных о погоде в электронную таблицу
Это веб-приложение PHP предназначено для получения данных о погоде, передаваемых платами разработки (ESP8266 и SIM808) через HTTP-запрос Get, и добавления этих данных в заданную электронную таблицу (по идентификатору) в Google Таблицах с проверенными учетными данными и токеном.
Веб-приложение требует, чтобы клиентская библиотека Google для PHP добавляла данные о погоде в заданную электронную таблицу в Google Таблицах.
⭐ Итак, прежде всего, создайте папку с именем remote_weather_station на своем сервере и установите на нем клиентскую библиотеку Google для PHP.
удаленная_погодная_станция папка должна включать эти четыре файла в дополнение к клиентской библиотеке Google для работы:
- index.php
- account_verification_token.php
- credentials.json (шаг 2.1)
- token.json (шаг 3.1)
На этом этапе я рассмотрю первые два файла - index.php и account_verification_token.php:
💻 index.php
⭐ Получите местные данные о погоде с метеостанции с помощью запроса Get:
// направление ветра (wd), средняя скорость ветра (a_ws), максимальная скорость ветра (m_ws), 1 час осадков (1_rf), 24 часа осадков (24_rf), температура (tem), влажность (hum), Барометрическое давление (b_pr).
$ variables_from_module;
if (isset ($ _ GET ['wd']) &&isset ($ _ GET ['a_ws']) &&isset ($ _ GET ['m_ws'] ) &&isset ($ _ GET ['1_rf']) &&isset ($ _ GET ['24_rf']) &&isset ($ _ GET ['tem']) &&isset ($ _ GET ['hum']) &&isset ($ _ GET ['b_pr'])) {
$ variables_from_module =[
"wd" => (int) $ _ GET ['wd'],
"a_ws" => (float) $ _ GET ['a_ws'],
"m_ws" => (float) $ _ GET ['m_ws'],
"1_rf" => (float) $ _ GET ['1_rf'],
"24_rf" => (float) $ _ GET ['24_rf'],
"tem" => (float) $ _ GET ['tem'],
"hum" => (int) $ _ GET ['гул'],
"b_pr" => (float) $ _ GET ['b_pr']
];
} else {
$ variables_from_module =[
"wd" => "err",
"a_ws" => "err",
"m_ws" => "err",
"1_rf" => "err",
"24_rf" => "err",
"tem" => "err",
"hum" => "err",
"b_pr" => "err"
];
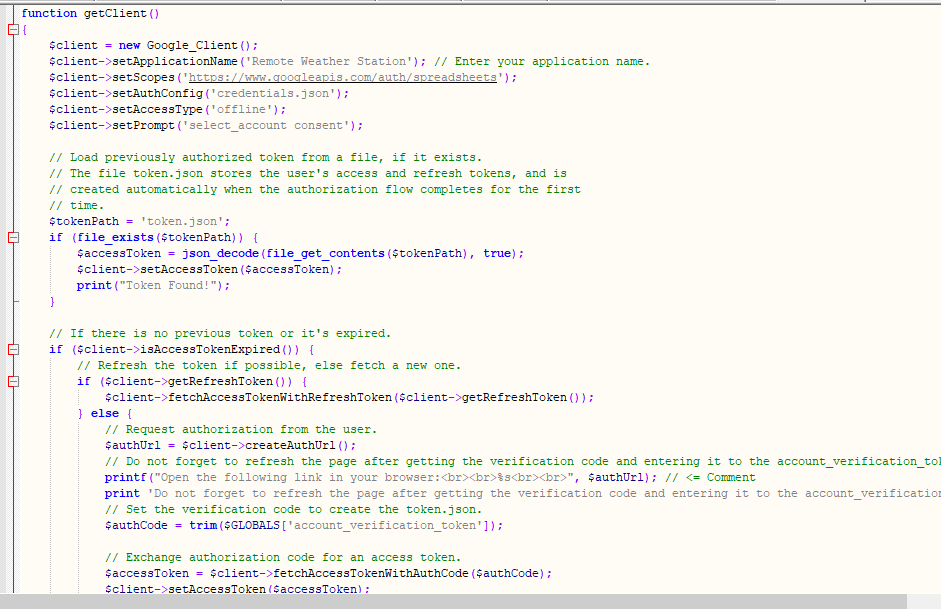
} ⭐ Подключитесь к приложению консоли разработчика Google под названием Remote Weather Station . с помощью credentials.json файл (шаг 2.1) .
  $ client =new Google_Client ();
 $ client-> setApplicationName ('Удаленная метеостанция'); // Введите имя вашего приложения.
 $ client-> setScopes ('https://www.googleapis.com/auth/spreadsheets');
 $ client-> setAuthConfig ('credentials.json');
 $ client-> setAccessType ('offline');
 $ client-> setPrompt ('select_account accept');
⭐ Загрузить ранее авторизованный токен из файла ( token.json ), если он существует.
  $ tokenPath ='token.json';
 if (file_exists ($ tokenPath)) {
 $ accessToken =json_decode (file_get_contents ($ tokenPath), true);
 $ client-> setAccessToken ($ accessToken);
 print («Токен найден!»);
}
⭐ Если предыдущего токена нет или срок его действия истек, запросите авторизацию у пользователя и установите код подтверждения для создания token.json файл с помощью file_put_contents () функция.
if ($ client-> isAccessTokenExpired ()) {
// Обновите токен, если возможно, иначе получите новый.
if ($ client-> getRefreshToken ()) {
$ client-> fetchAccessTokenWithRefreshToken ($ client-> getRefreshToken ());
} else {
// Запросить авторизацию у пользователя.
$ authUrl =$ client-> createAuthUrl ();
...
// Устанавливаем проверочный код для создания токена.json.
$ authCode =trim ($ GLOBALS ['account_verification_token' ]);
...
// Проверяем, была ли ошибка и введен ли account_verification_token.
if (array_key_exists ('error', $ accessToken)) {
throw new Exception (join (',', $ accessToken));
} else {
print («Успешно! Обновите страницу.»);
}
}
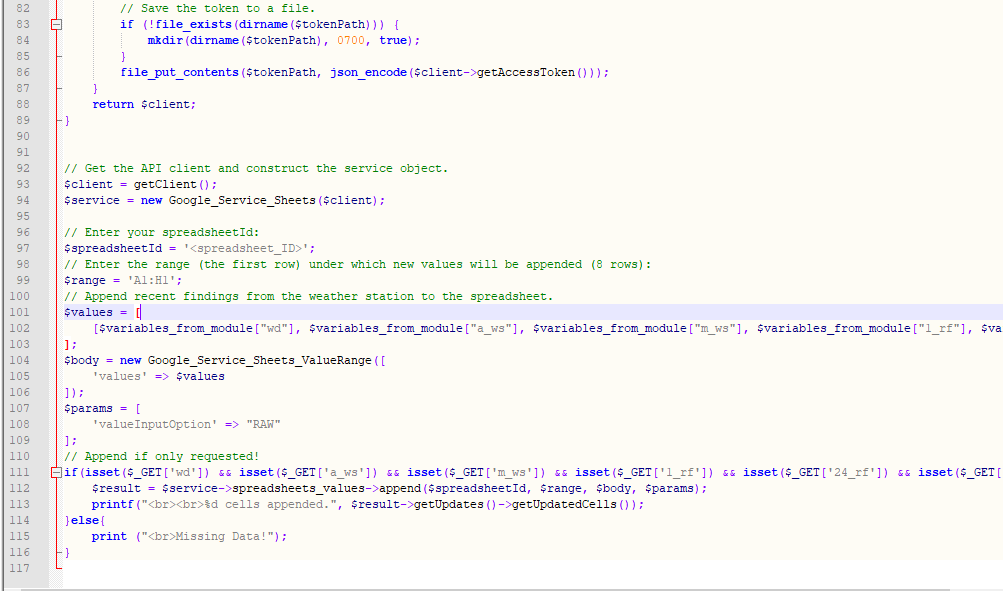
// Сохраняем токен в файл.
if (! file_exists (dirname ($ tokenPath))) {
mkdir (dirname ($ tokenPath), 0700 , true);
}
file_put_contents ($ tokenPath, json_encode ($ client-> getAccessToken ()));
} ⭐ Введите идентификатор таблицы и диапазон, чтобы добавить в нее последние результаты, полученные с метеостанции.
https://docs.google.com/spreadsheets/d/spreadsheetId/edit#gid=0
// Введите свой spreadsheetId:
$ spreadsheetId ='';
// Введите диапазон (первая строка), под которым будут добавлены новые значения (8 строк) :
$ range ='A1:H1';
// Добавляем последние данные метеостанции в таблицу.
$ values =[
[$ variables_from_module ["wd" ], $ variables_from_module ["a_ws"], $ variables_from_module ["m_ws"], $ variables_from_module ["1_rf"], $ variables_from_module ["24_rf"], $ variables_from_module ["tem"], $ variables_from_module ["hum" $ variables_from_module ["b_pr"]]
];
$ body =new Google_Service_Sheets_ValueRange ([
'values' => $ values
]);
$ params =[
'valueInputOption' => "RAW"
];
...
$ result =$ service-> spreadsheets_values-> append ( $ spreadsheetId, $ range, $ body, $ params);
printf ("
% d ячеек добавлено.", $ result-> getUpdates () -> getUpdatedCells ()); 💻 account_verification_token.php
⭐ После авторизации веб-приложения созданным AuthUrl , введите указанный проверочный код, чтобы установить токен доступа.
$ account_verification_token ="<Введите токен>"; // Вводим проверочный код после авторизации.
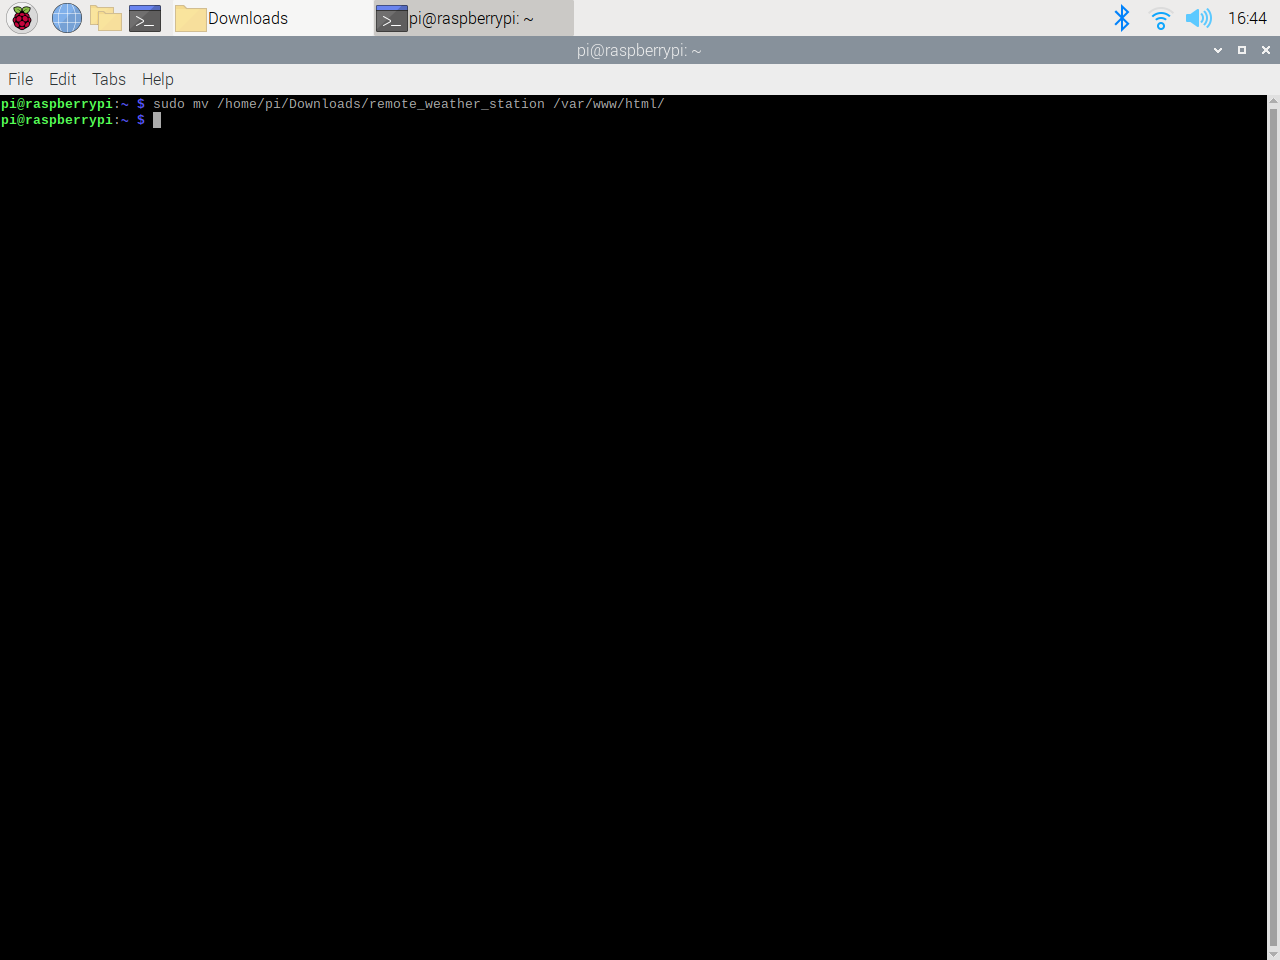
Шаг 3.1:Настройка веб-приложения на Raspberry Pi (или на любом сервере)
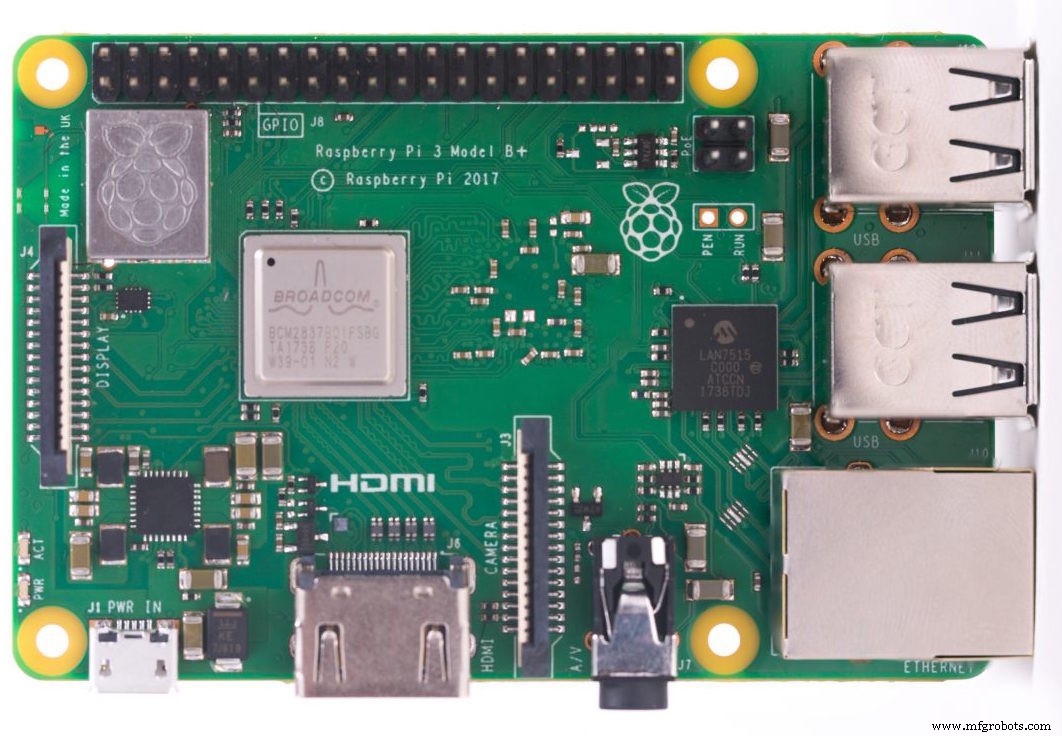
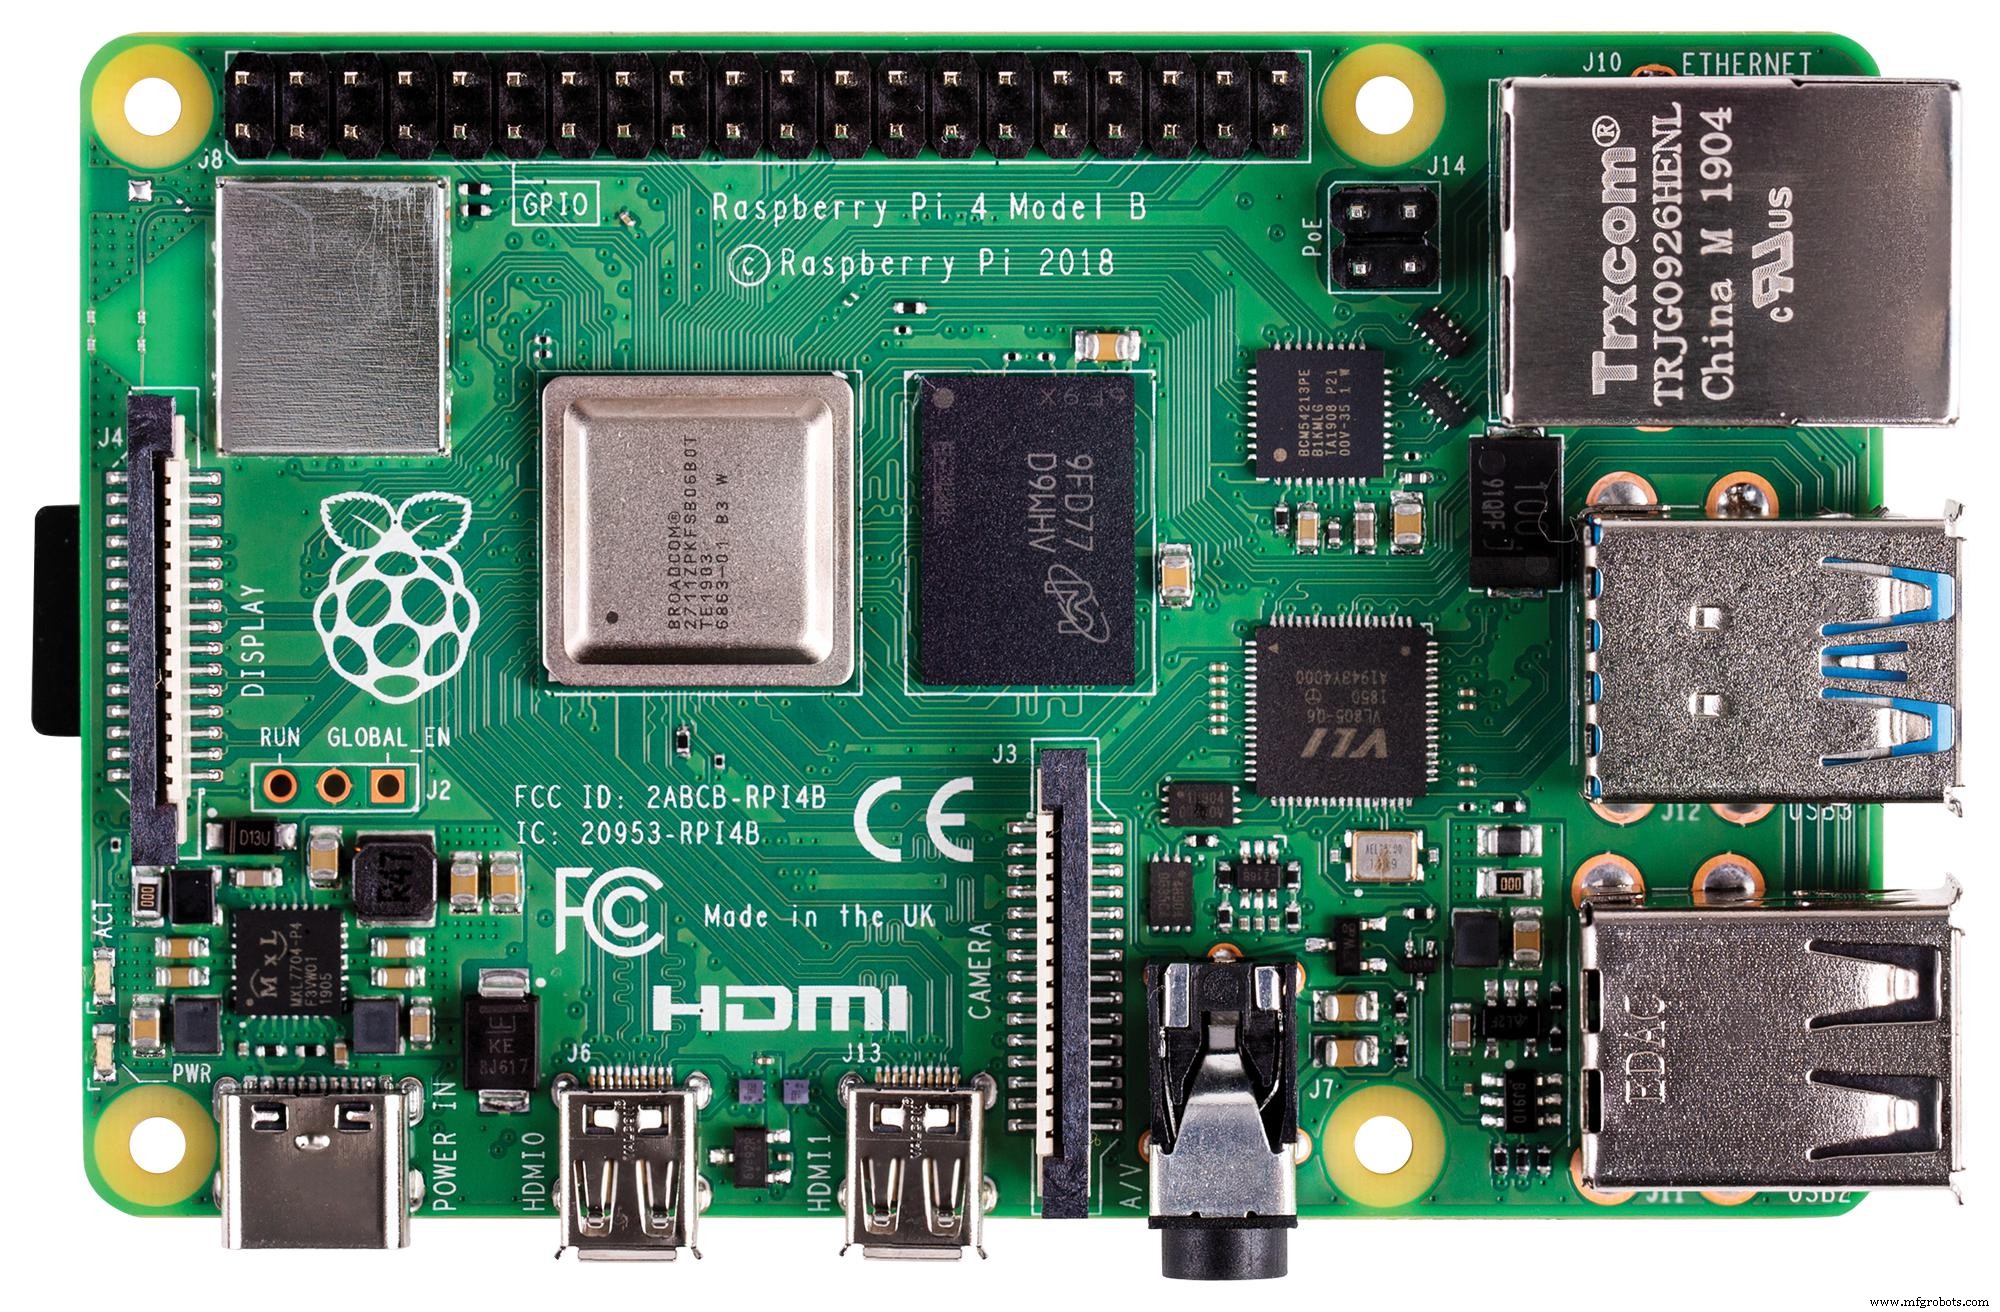
После создания веб-приложения PHP я решил запустить его на моем Raspberry Pi, но вы можете запускать приложение на любом сервере, если это сервер PHP.
Если вы хотите использовать Raspberry Pi, но не знаете, как настроить веб-сервер LAMP на Raspberry Pi, вы можете изучить это руководство.
⭐ Прежде всего, переместите папку приложения (remote_weather_station) на сервер Apache (/ var / www / html) с помощью терминала, поскольку сервер Apache является защищенным местом.
sudo mv / home / pi / Downloads / remote_weather_station / var / www / html /
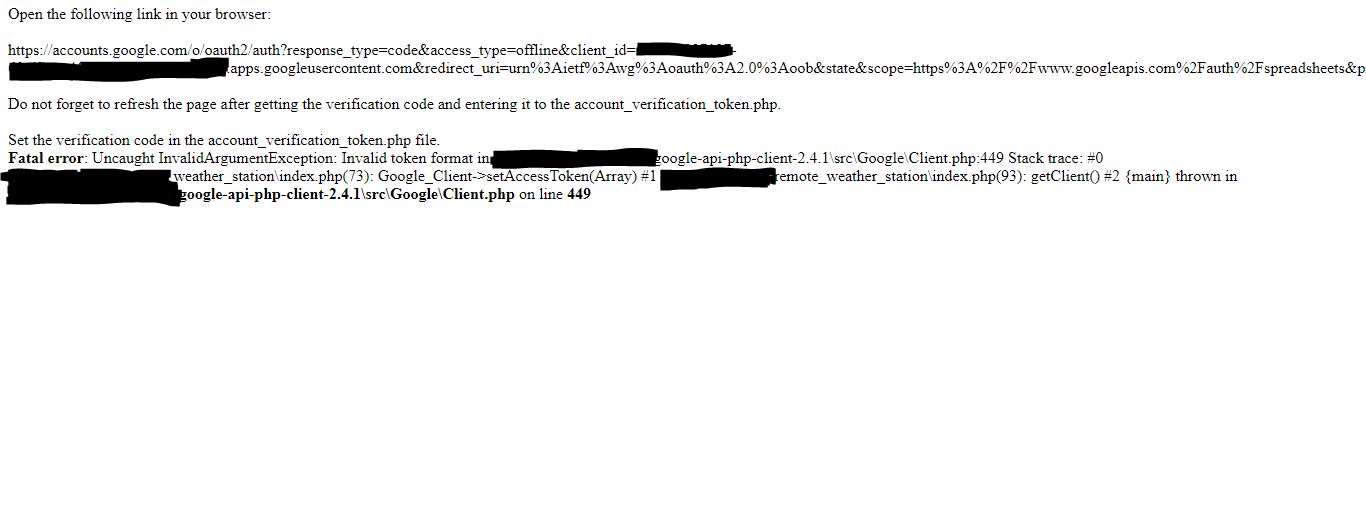
⭐ Веб-приложение выдает ошибку при первом открытии из-за отсутствия кода подтверждения. Чтобы получить код подтверждения, перейдите по созданной приложением ссылке авторизации.
⭐ Затем нажмите Перейти к удаленной метеостанции (небезопасно) .
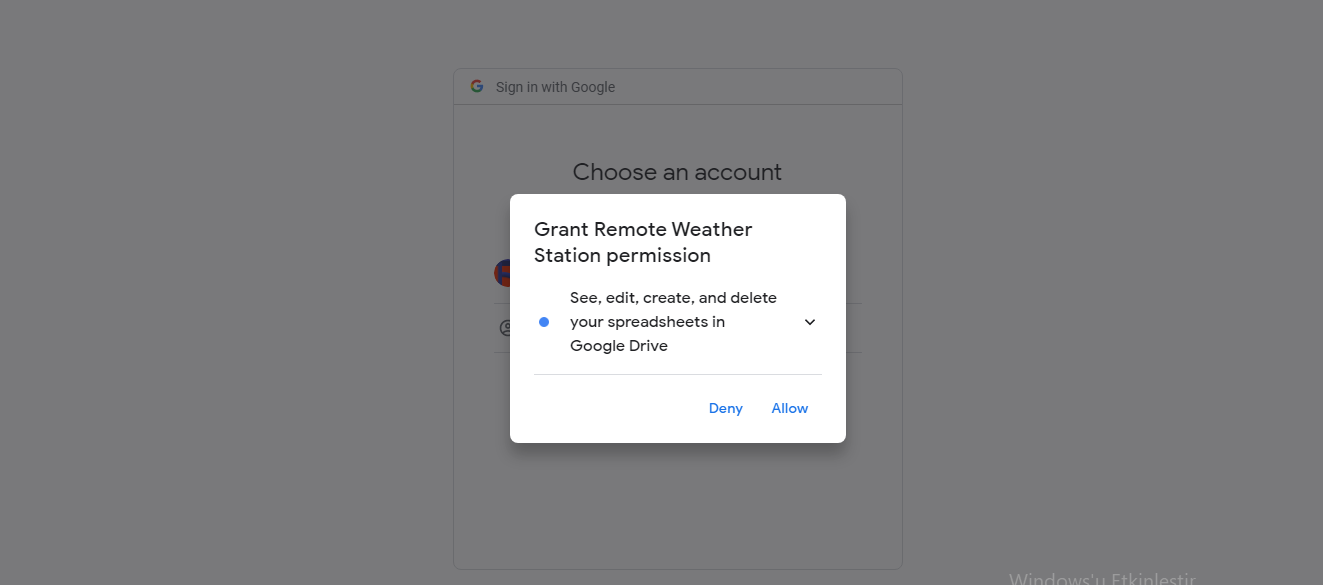
⭐ Предоставьте приложению необходимые разрешения.
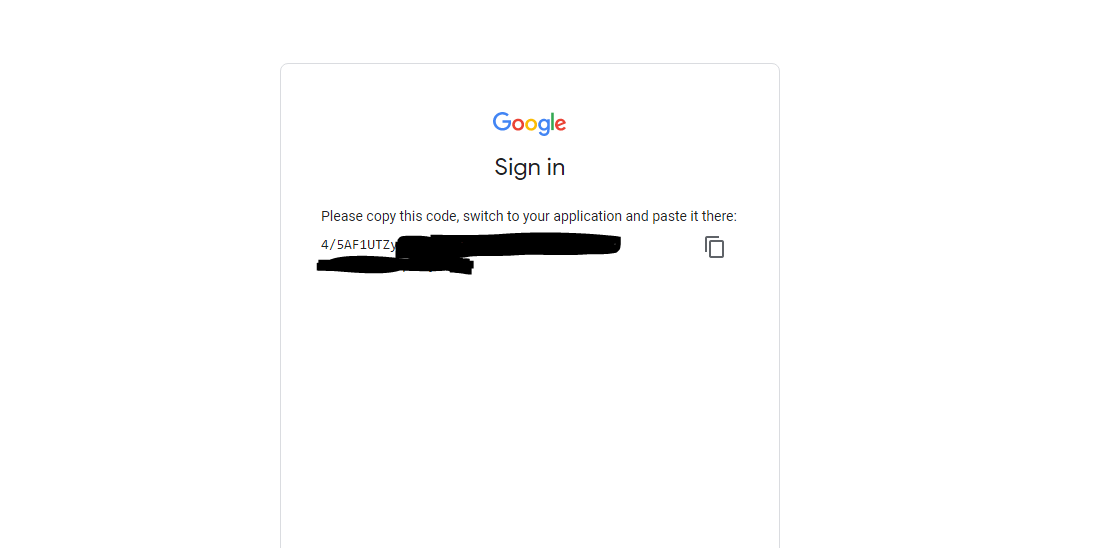
⭐ Теперь скопируйте код подтверждения и вставьте его в account_verification_token.php .
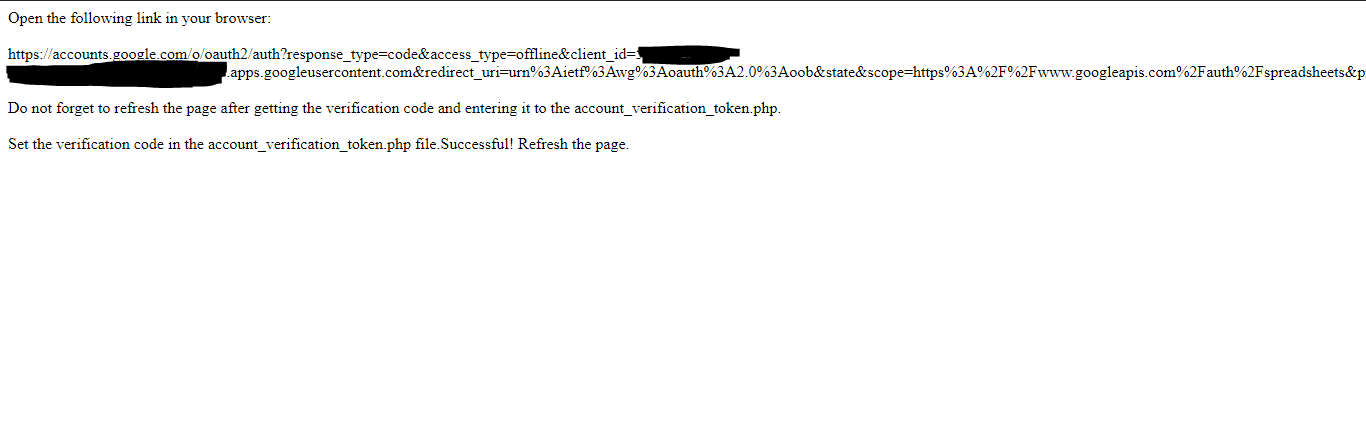
⭐ Вернитесь в веб-приложение. Должно отобразиться подтверждающее сообщение: Успешно! Обновите страницу .
⭐ После обновления страницы веб-приложение использует проверочный код для получения токена доступа и сохраняет токен доступа в файле с именем token.json . Таким образом, он больше не выдаст ошибку.

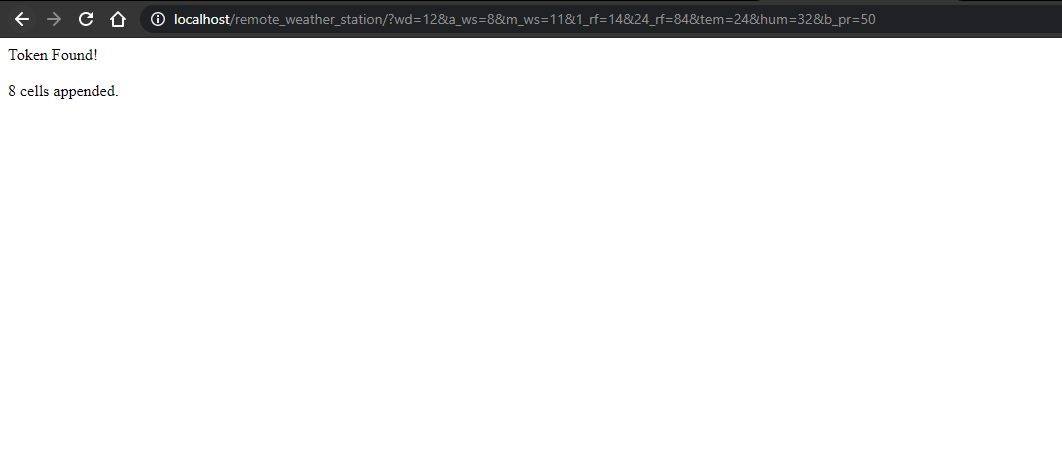
⭐ Чтобы проверить, правильно ли веб-приложение PHP добавляет новые данные в данную электронную таблицу:
http:// localhost / remote_weather_station /? wd =12 &a_ws =8 &m_ws =11 &1_rf =14 &24_rf =84 &tem =24 &hum =32 &b_pr =57
Шаг 4. Считывание и отправка данных о погоде с помощью ESP8266 (Wi-Fi)
Чтобы собрать данные о погоде на своем балконе, я использовал плату разработки NodeMCU ESP-12E (ESP8266) с метеостанцией.
Я запрограммировал его на отправку данных о погоде в веб-приложение PHP каждые пять минут.

⭐ Включите необходимые библиотеки и определите настройки Wi-Fi.
  #include
 #include
 #include
 #include
 #include

 // Определите настройки WiFi.
 const char * ssid ="";
 const char * password =" ";
⭐ Определите настройки метеостанции и контакты последовательного подключения - D6, D5.
  // Определить настройки метеостанции:
 char databuffer [35];
 double temp;
 int transferring =0;

 // Определить контакты последовательного подключения - RX и TX.
 SoftwareSerial Serial_1 (D6, D5); // (Rx, Tx)
⭐ В getBuffer () функция, получить данные с метеостанции.
void getBuffer () {
int index;
for (index =0; index <35; index ++) {
if (Serial_1.available ()) {
буфер данных [индекс] =Serial_1.read ();
if (буфер данных [0]! ='c') {
index =-1;
}
}
else {
index -;
}
}
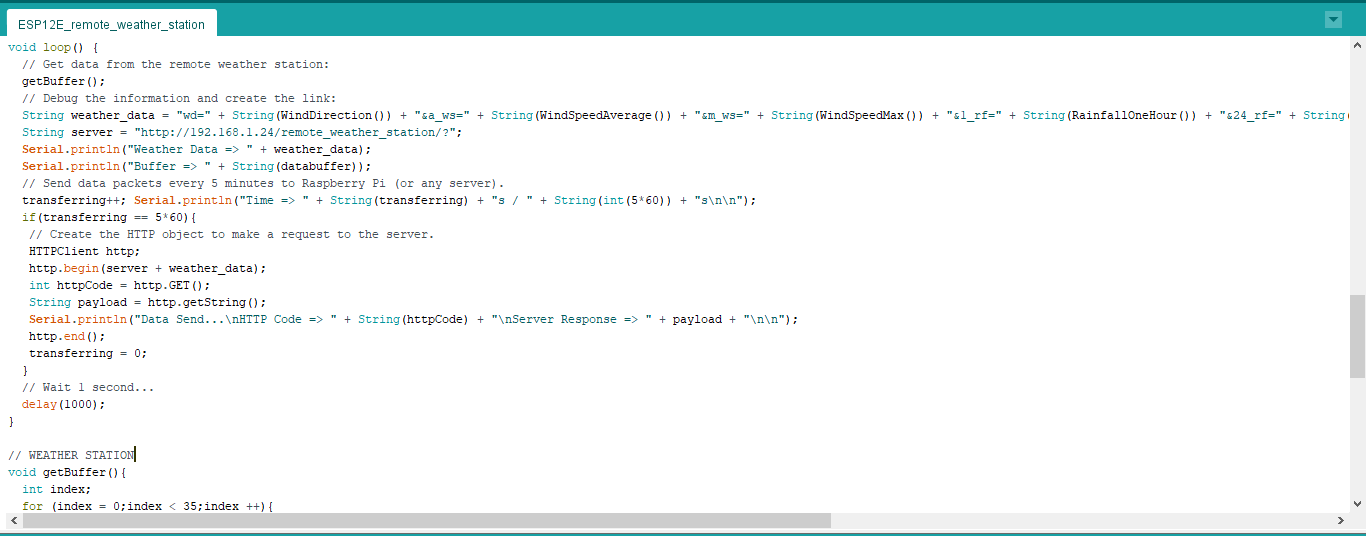
} ⭐ Выполните отладку данных о погоде и создайте ссылку.
  String weather_data ="wd =" + String (WindDirection ()) + "&a_ws =" + String (WindSpeedAverage ()) + "&m_ws =" + String (WindSpeedMax ()) + "&1_rf =" + String (RainfallOneHour ()) + "&24_rf =" + String (RainfallOneDay ()) + "&tem =" + String (Temperature ()) + "&hum =" + String (Humidity ()) + "&b_pr =" + String ( BarPressure ());
 String server ="http://192.168.1.24/remote_weather_station/?";

 ...

 int WindDirection () { return transCharToInt (буфер данных, 1,3); } // Направление ветра (градусы)

 float WindSpeedAverage () {temp =0.44704 * transCharToInt (databuffer, 5,7); возвратная температура; } // Средняя скорость воздуха (1 минута)

 float WindSpeedMax () {temp =0.44704 * transCharToInt (databuffer, 9,11); возвратная температура; } // Максимальная скорость воздуха (5 минут)

 Температура float () {temp =(transCharToInt (databuffer, 13,15) - 32.00) * 5.00 / 9.00; возвратная температура; } // Температура ("C")

 float RainfallOneHour () {temp =transCharToInt (databuffer, 17,19) * 25,40 * 0,01; возвратная температура; } // Осадки (1 час)

 float RainfallOneDay () {temp =transCharToInt (databuffer, 21,23) * 25,40 * 0,01; возвратная температура; } // Осадки (24 часа)

 int Humidity () {return transCharToInt (databuffer, 25,26); } // Влажность (%)

 float BarPressure () {temp =transCharToInt (databuffer, 28,32); обратная температура / 10.00; } // Барометрическое давление (гПа)
⭐ Отправляйте пакеты данных каждые 5 минут на Raspberry Pi (или любой другой сервер).
  передача ++; Serial.println ("Time =>" + String (передача) + "s /" + String (int (5 * 60)) + "s \ n \ n");
 if (передача ==5 * 60) {
 // Создаем объект HTTP, чтобы сделать запрос к серверу.
 HTTPClient http;
 http.begin (сервер + погодные_данные);
 int httpCode =http.GET ();
 String payload =http.getString ();
 Serial.println("Data Send...\nHTTP Code => " + String(httpCode) + "\nServer Response => " + payload + "\n\n");
 http.end();
 transferring =0;
 }
 // Wait 1 second...
 delay(1000);
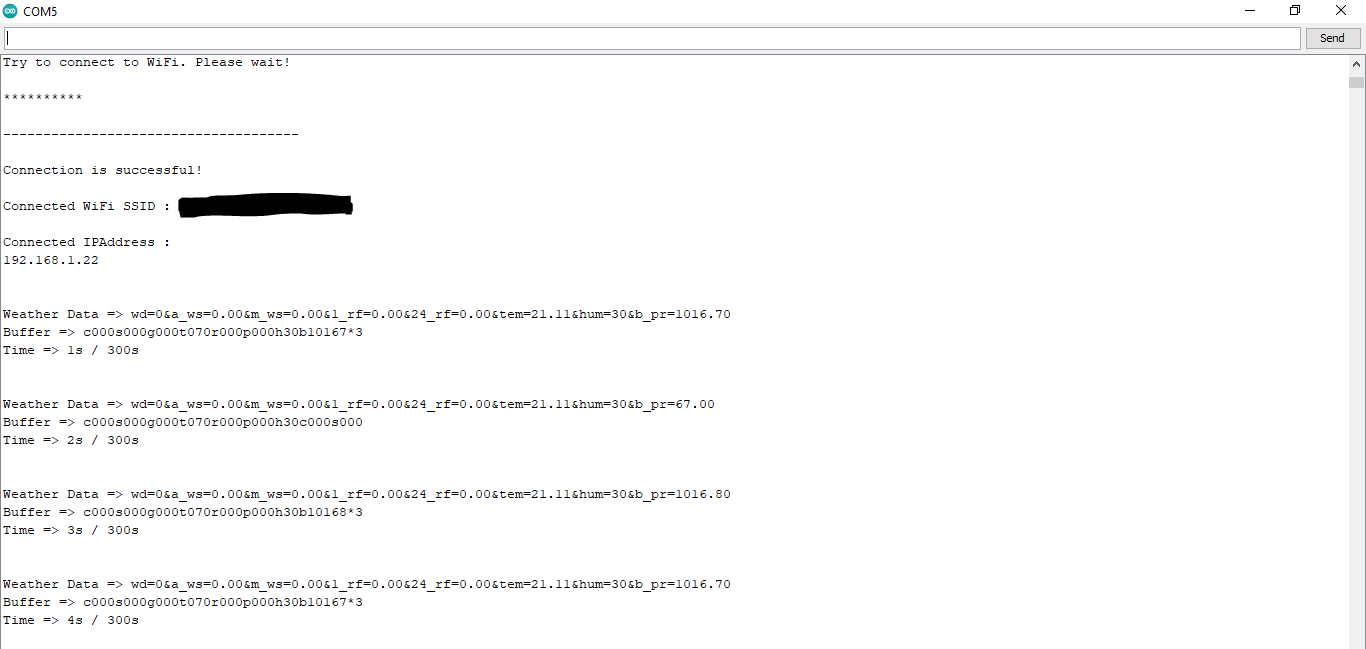
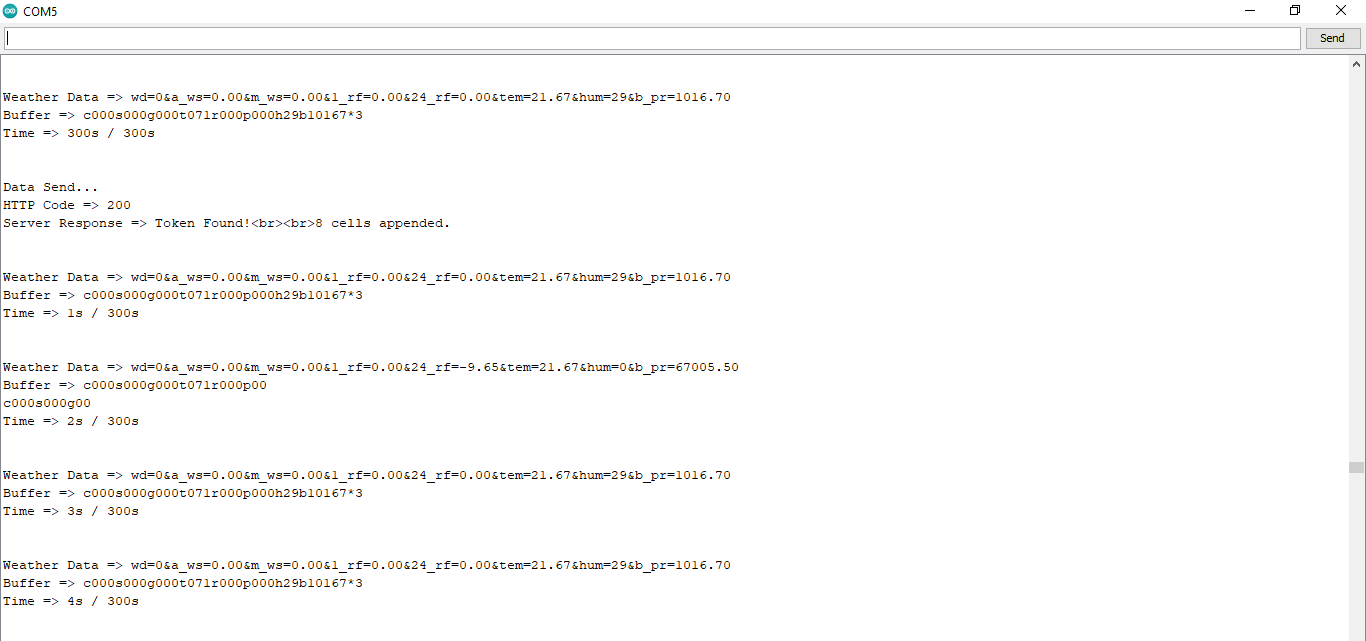
⭐ After uploading the code to the NodeMCU ESP-12E (ESP8266) development board, it displays weather data every second on the serial monitor and sends data packets every five minutes (300 seconds) to the PHP web application.
Connection is successful!

...

Weather Data => wd=0&a_ws=0.00&m_ws=0.00&1_rf=0.00&24_rf=0.00&tem=21.67&hum=29&b_pr=1016.70
Buffer => c000s000g000t071r000p000h29b10167*3
Time => 299s / 300s


Weather Data => wd=0&a_ws=0.00&m_ws=0.00&1_rf=0.00&24_rf=0.00&tem=21.67&hum=29&b_pr=1016.70
Buffer => c000s000g000t071r000p000h29b10167*3
Time => 300s / 300s

...
⭐ Then, it shows the response from the server.
...

Data Send...
HTTP Code => 200
Server Response => Token Found!

8 cells appended.

...
Step 4.1:Reading and sending weather data with SIM808 (GPRS)
To collect weather data in my backyard, I used a SIM808 shield for Arduino Uno if the distance between the weather station and my router is too far away.
Most of the code is the same and covered in the previous step aside from the parts below.
⭐ Include required libraries and define the sim808 object.
For SIM808 GPS/GPRS/GSM Shield | Скачать
#include
#include

// Define the sim808.
DFRobot_SIM808 sim808(&Serial);
⭐ Initialize the SIM808 module and continue if it is working accurately.
//******** Initialize sim808 module *************
while(!sim808.init()) {
delay(1000);
Serial.print("Sim808 init error\r\n");
}
delay(2000);
// Continue if the SIM808 Module is working accurately.
Serial.println("Sim808 init success");
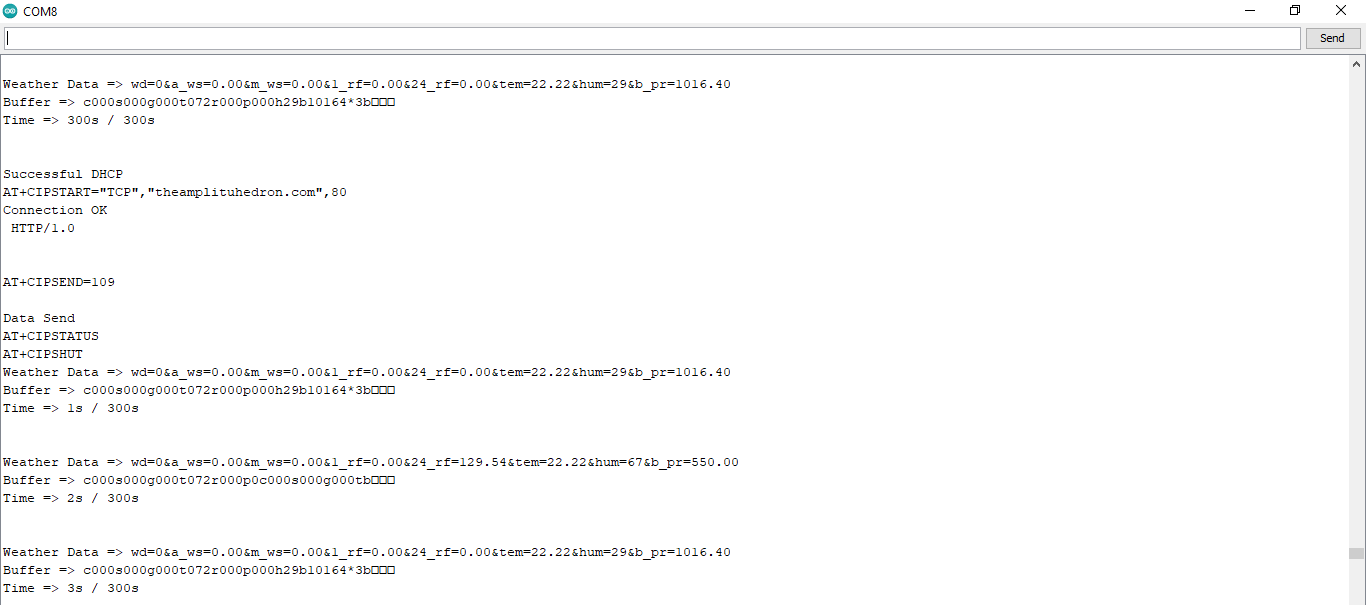
delay(5000); ⭐ Send data packets every 5 minutes to the server by establishing a TCP connection to make a GET request.
transferring++; Serial.println("Time => " + String(transferring) + "s / " + String(int(5*60)) + "s\n\n");
if(transferring ==5*60){
//*********** Attempt DHCP *******************
while(!sim808.join(F("cmnet"))) {
Serial.println("Sim808 join network error!");
delay(2000);
}
//************ Successful DHCP ****************
delay(5000);
Serial.println("Successful DHCP");
//*********** Establish a TCP connection ************
if(!sim808.connect(TCP,"192.168.1.24", 80)) { // Change it with your server.
Serial.println("Connection Error");
}else{
Serial.println("Connection OK");
}
delay(2000);
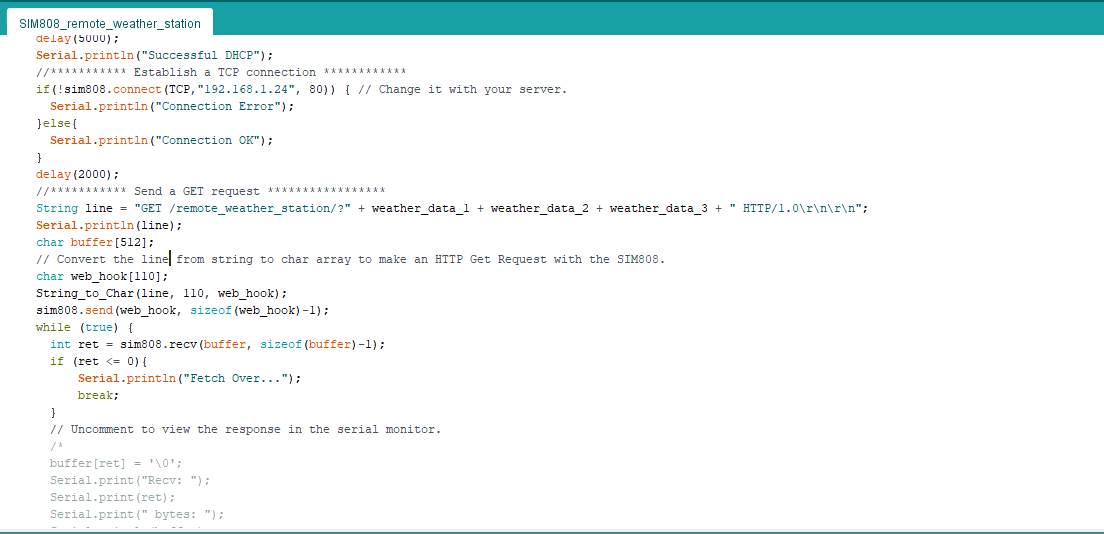
... ⭐ After creating the line string, convert it from string to char array to make an HTTP Get Request with the SIM808.
...

 String line ="GET /remote_weather_station/?" + weather_data_1 + weather_data_2 + weather_data_3 + " HTTP/1.0\r\n\r\n";
 Serial.println(line);
 char buffer[512];
 // Convert the line from string to char array to make an HTTP Get Request with the SIM808.
 char web_hook[110];
 String_to_Char(line, 110, web_hook);
 sim808.send(web_hook, sizeof(web_hook)-1);
 while (true) {
 int ret =sim808.recv(buffer, sizeof(buffer)-1);
 if (ret <=0){
 Serial.println("Fetch Over...");
 break;
 }

 ...
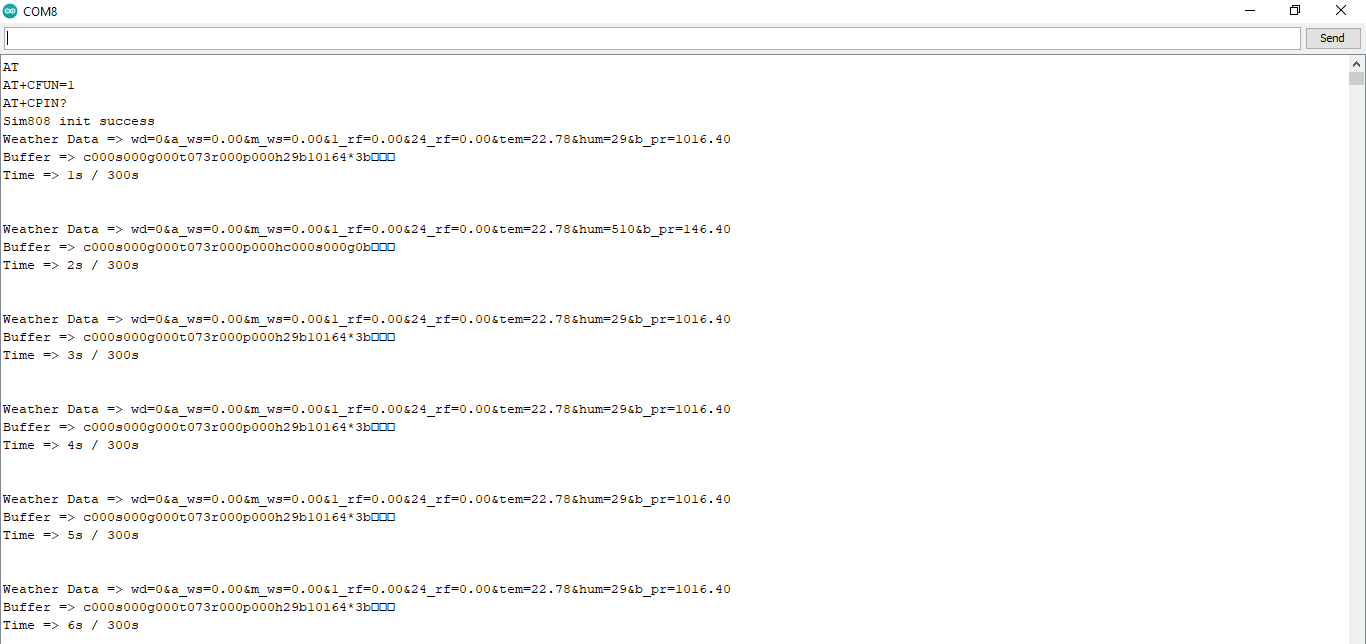
⭐ After uploading the code to the SIM808 shield, it displays weather data every second on the serial monitor and sends data packets every five minutes (300 seconds) to the PHP web application.
Step 4.2:Creating the weather data set for more than three months
After finishing coding, I started to collate weather data on Google Sheets every five minutes for more than three months to build a neural network model and make predictions on the rainfall intensity.
Collected Weather Data:
- Wind Direction (deg)
- Average Wind Speed (m/s)
- Max Wind Speed (m/s)
- One-Hour Rainfall (mm)
- 24-Hours Rainfall (mm)
- Temperature (°C)
- Humidity (%)
- Barometric Pressure (hPa)
Then, I downloaded the spreadsheet as Remote Weather Station.csv , consisting of 32219 rows as my preliminary local weather data set. I am still collating weather data to improve my data set and model :)
Step 5:Building an Artificial Neural Network (ANN) with TensorFlow
When I completed collating my preliminary local weather data set, I started to work on my artificial neural network (ANN) model to make predictions on the rainfall intensity.
I decided to create my neural network model with TensorFlow in Python. So, first of all, I followed the steps below to grasp a better understanding of the weather data:
- Data Visualization
- Data Scaling (Normalizing)
- Data Preprocessing
- Data Splitting
After applying these steps, I decided to use my neural network model to classify different rainfall intensity classes theoretically assigned as labels (outputs) for each input (row). I created my classes according to the rate of precipitation, which depends on the considered time.
The following categories are used to classify rainfall intensity by the rate of precipitation (rainfall):
- Light rain — when the precipitation rate is <2.5 mm per hour
- Moderate rain — when the precipitation rate is between 2.5 mm and 7.6 mm per hour
- Heavy rain — when the precipitation rate is between 7.6 mm and 50 mm per hour
- Violent rain — when the precipitation rate is> 50 mm per hour
According to the precipitation (rainfall) rates, I preprocessed the weather data to assign one of these five classes for each input as its label:
- 0 (None)
- 1 (Light Rain)
- 2 (Moderate Rain)
- 3 (Heavy Rain)
- 4 (Violent Rain)
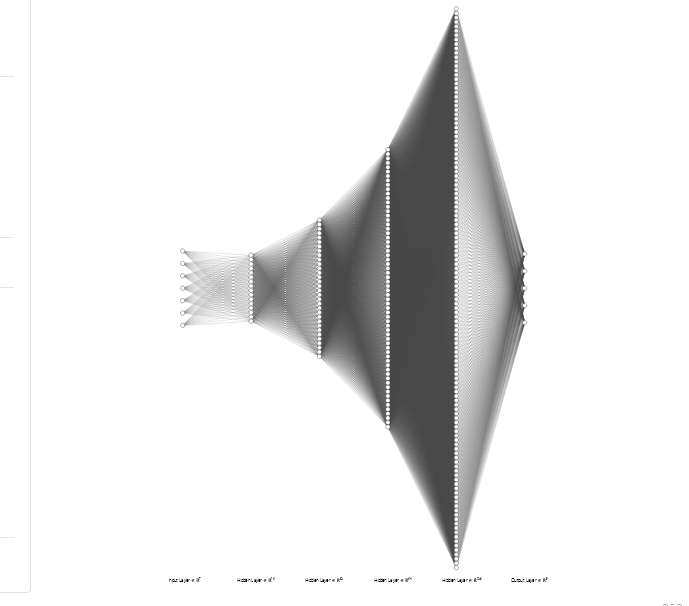
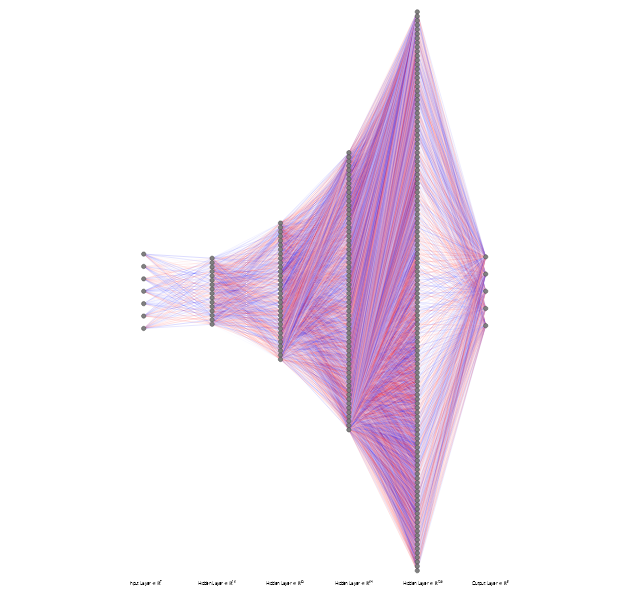
After scaling (normalizing) and preprocessing the weather data, I elicited seven input variables and one label for each reading, classified with the five mentioned classes. Then, I built an artificial neural network model with TensorFlow to obtain the best possible results and predictions with my preliminary data set.
Layers:
- 7 [Input]
- 16 [Hidden]
- 32 [Hidden]
- 64 [Hidden]
- 128 [Hidden]
- 5 [Output]
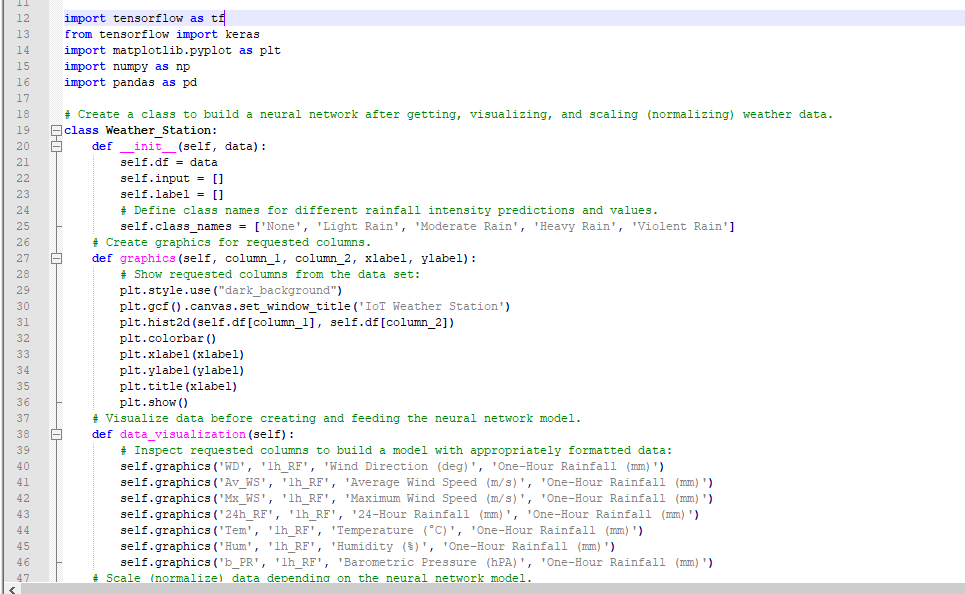
To execute all steps above, I created a class named Weather_Station in Python after including the required libraries:
import tensorflow as tf
from tensorflow import keras
import matplotlib.pyplot as plt
import numpy as np
import pandas as pd
Subsequently, I will discuss coding in Python for each step I mentioned above.
Also, you can download IoT_weather_station_neural_network.py to inspect coding.
Step 5.1:Visualizing and scaling (normalizing) the weather data
Before diving in to build a model, it is important to understand the weather data to pass the model appropriately formatted data.
So, in this step, I will show you how to visualize weather data and scale (normalize) in Python.
⭐ First of all, read the weather data from Remote Weather Station.csv .
csv_path ="E:\PYTHON\Remote Weather Station.csv"
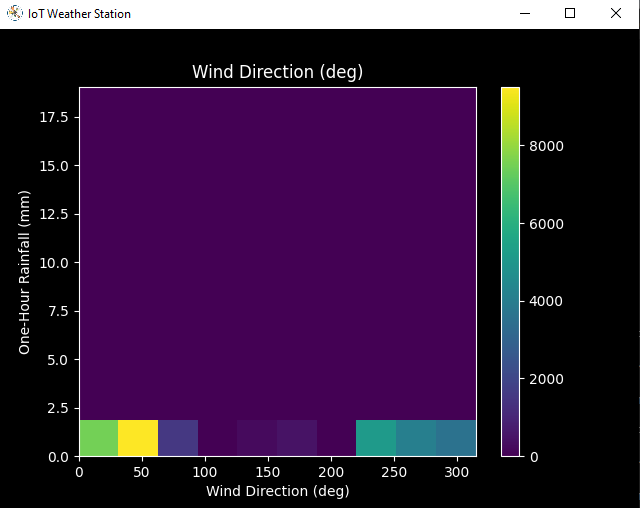
df =pd.read_csv(csv_path) ⭐ In the graphics() function, visualize the requested columns from the weather data set by using the Matplotlib library.
def graphics(self, column_1, column_2, xlabel, ylabel):
# Show requested columns from the data set:
plt.style.use("dark_background")
plt.gcf().canvas.set_window_title('IoT Weather Station')
plt.hist2d(self.df[column_1], self.df[column_2])
plt.colorbar()
plt.xlabel(xlabel)
plt.ylabel(ylabel)
plt.title(xlabel)
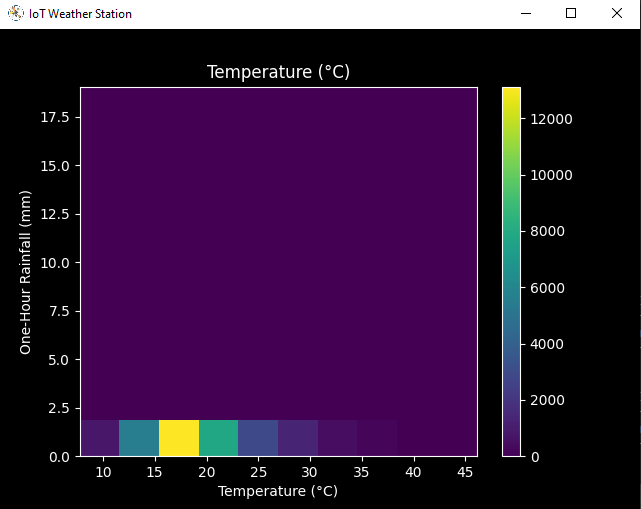
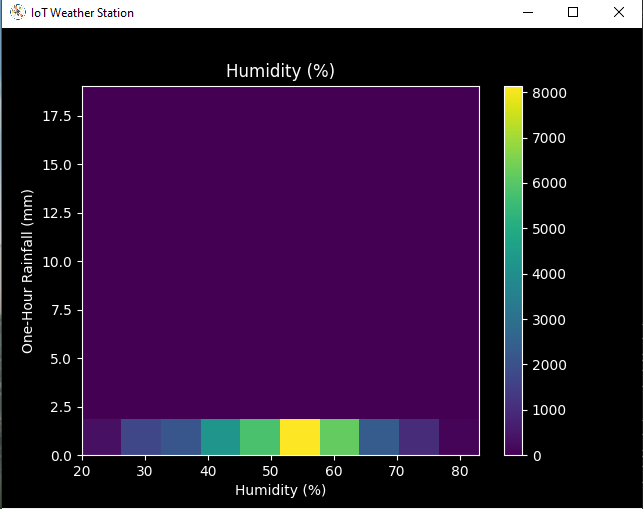
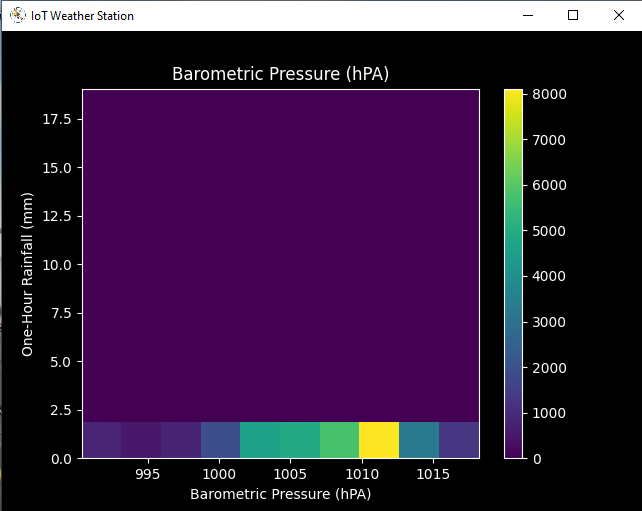
plt.show() ⭐ In the data_visualization() function, inspect all columns before scaling weather data to build a model with appropriately formatted data.
def data_visualization(self):
 # Inspect requested columns to build a model with appropriately formatted data:
 self.graphics('WD', '1h_RF', 'Wind Direction (deg)', 'One-Hour Rainfall (mm)')
 self.graphics('Av_WS', '1h_RF', 'Average Wind Speed (m/s)', 'One-Hour Rainfall (mm)')
 self.graphics('Mx_WS', '1h_RF', 'Maximum Wind Speed (m/s)', 'One-Hour Rainfall (mm)')
 self.graphics('24h_RF', '1h_RF', '24-Hour Rainfall (mm)', 'One-Hour Rainfall (mm)')
 self.graphics('Tem', '1h_RF', 'Temperature (°C)', 'One-Hour Rainfall (mm)')
 self.graphics('Hum', '1h_RF', 'Humidity (%)', 'One-Hour Rainfall (mm)')
 self.graphics('b_PR', '1h_RF', 'Barometric Pressure (hPA)', 'One-Hour Rainfall (mm)')
After visualizing weather data, I scaled (normalized) each column to format it properly.
Normally, each row (reading) looked like this before scaling:
- 315, 0.45, 0, 0.51, 0.51, 22.78, 65, 1005.5
⭐ In the scale_data() function:
⭐ The wind direction in units of degrees and angles do not make good model inputs. 360° and 0° should be close to each other and wrap around smoothly. The direction should not matter if the wind is not blowing. Thus, convert the wind direction and velocity columns to a wind vector to interpret them easily with a neural network model.
def scale_data(self):
 # Wind Direction and Speed:
 wv =self.df.pop('Av_WS')
 max_wv =self.df.pop('Mx_WS')
 # Convert to radians.
 wd_rad =self.df.pop('WD')*np.pi / 180
 # Calculate the wind x and y components.
 self.df['scaled_WX'] =wv*np.cos(wd_rad)
 self.df['scaled_WY'] =wv*np.sin(wd_rad)
 # Calculate the max wind x and y components.
 self.df['scaled_max_WX'] =max_wv*np.cos(wd_rad)
 self.df['scaled_max_WY'] =max_wv*np.sin(wd_rad)

 ...
⭐ For the remaining columns except for 1h_RF , divide them into average reading values to scale (normalize) and format.
...

 # Temperature:
 tem =self.df.pop('Tem')
 self.df['scaled_Tem'] =tem / 25
 # Humidity:
 hum =self.df.pop('Hum')
 self.df['scaled_Hum'] =hum / 70
 # Barometric Pressure:
 bPR =self.df.pop('b_PR')
 self.df["scaled_bPR"] =bPR / 1013
 # 24 Hour Rainfall (Approx.)
 rain_24 =self.df.pop('24h_RF')
 self.df['scaled_24h_RF'] =rain_24 / 24
After completing scaling (normalizing), I extracted these new columns from the weather data set:
- scaled_WX
- scaled_WY
- scaled_max_WX
- scaled_max_WY
- scaled_Tem
- scaled_Hum
- scaled_bPR
- scaled_24h_RF
Step 5.2:Training the model (ANN) on the rainfall intensity classes
Before building and training a neural network model in TensorFlow, I needed to create the input array and the label array by preprocessing the scaled and normalized weather data set.
⭐ In the create_input_and_label() function:
⭐ Firstly, append each input element as a NumPy array to the input array and convert it to a NumPy array by using the asarray() функция.
⭐ Each input element includes seven variables [shape=(7, )]:
- [scaled_WX, scaled_WY, scaled_max_WX, scaled_max_WY, scaled_Tem, scaled_Hum, scaled_bPR]
def create_input_and_label(self):
 n =len(self.df)
 # Create the input array using the scaled variables:
 for i in range(n):
 self.input.append(np.array([self.df['scaled_WX'][i], self.df['scaled_WY'][i], self.df['scaled_max_WX'][i], self.df['scaled_max_WY'][i], self.df['scaled_Tem'][i], self.df['scaled_Hum'][i], self.df['scaled_bPR'][i]]))
 self.input =np.asarray(self.input)

 ...
⭐ Then, evaluate the approximate rainfall (precipitation) rate for each reading (row).
approx_RF_rate =(1h_RF + scaled_24h_RF) * 100
⭐ According to the rainfall rate, assign a class [0 - 4] for each input element and append them to the label array.
...
for i in range(n):
_class =0
# Evaluate the approximate rainfall rate:
approx_RF_rate =(self.df['1h_RF'][i] + self.df['scaled_24h_RF'][i]) * 100
# As labels, assign classes of rainfall intensity according to the approximate rainfall rate (mm):
if approx_RF_rate ==0:
_class =0
elif approx_RF_rate <2.5:
_class =1
elif 2.5
elif 7.6
else:
_class =4
self.label.append(_class)
self.label =np.asarray(self.label) After preprocessing the scaled weather data to create input and label arrays, I split them as training (60%) and test (40%) data sets:
def split_data(self):
n =len(self.df)
# (60%, 40%) - (training, test)
self.train_input =self.input[0:int(n*0.6)]
self.test_input =self.input[int(n*0.6):]
self.train_label =self.label[0:int(n*0.6)]
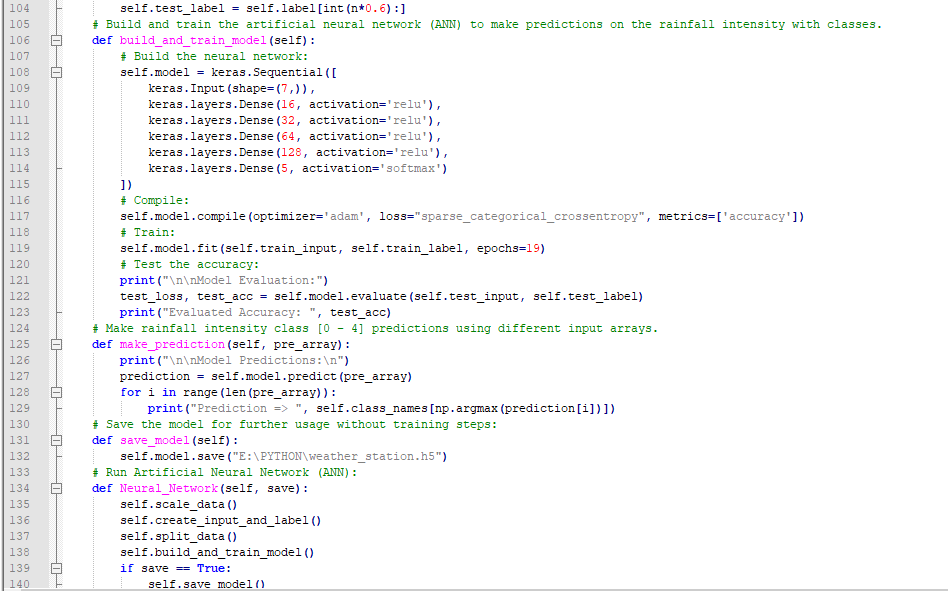
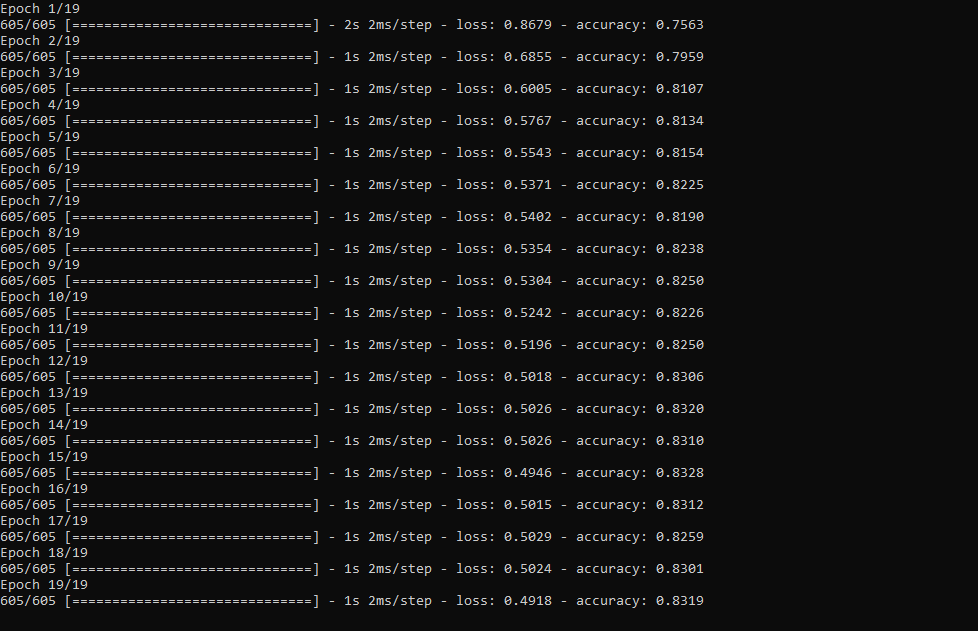
self.test_label =self.label[int(n*0.6):] Then, I built my artificial neural network (ANN) model by using Keras and trained it with the training data set for nineteen epochs.
You can inspect these tutorials to learn about activation functions, loss functions, epochs, etc.
def build_and_train_model(self):
 # Build the neural network:
 self.model =keras.Sequential([
 keras.Input(shape=(7,)),
 keras.layers.Dense(16, activation='relu'),
 keras.layers.Dense(32, activation='relu'),
 keras.layers.Dense(64, activation='relu'),
 keras.layers.Dense(128, activation='relu'),
 keras.layers.Dense(5, activation='softmax')
 ])
 # Compile:
 self.model.compile(optimizer='adam', loss="sparse_categorical_crossentropy", metrics=['accuracy'])
 # Train:
 self.model.fit(self.train_input, self.train_label, epochs=19)

 ...
After training with the preliminary training data set, the accuracy of the model is between 0.83 and 0.85 .
Step 5.3:Evaluating the model and making predictions on the rainfall intensity
After building and training my artificial neural network model, I tested its accuracy by using the preliminary testing data set.
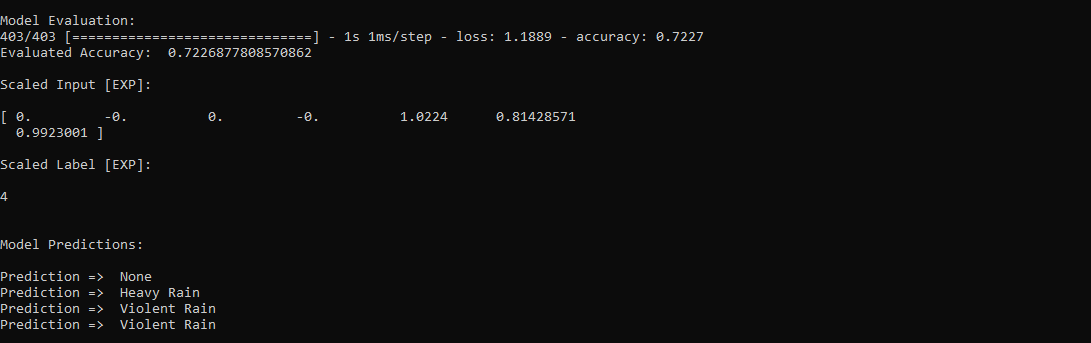
For now, the evaluated accuracy of the model is between 0.72 and 0.73 due to inadequate testing data set overfitting the model. However, I am still collecting weather data to improve the model accuracy.
...

 # Test the accuracy:
 print("\n\nModel Evaluation:")
 test_loss, test_acc =self.model.evaluate(self.test_input, self.test_label)
 print("Evaluated Accuracy:", test_acc)
Then, I used my neural network model to make predictions on the rainfall intensity with a given prediction array consisting of readings from the weather station after the training of the model. As a starting point, the model works fine :)
The model predicts possibilities of labels for each input element as an array of 5 numbers. They represent the model's "confidence" that the given input element corresponds to each of the five different classes of rainfall intensity [0 - 4].
⭐ In the make_prediction() function, make a prediction for each input element in a given array and get the most accurate label [0 - 4] by using the argmax() function to display its class name.
def make_prediction(self, pre_array):
 print("\n\nModel Predictions:\n")
 prediction =self.model.predict(pre_array)
 for i in range(len(pre_array)):
 print("Prediction => ", self.class_names[np.argmax(prediction[i])])
Prediction Inputs:
- [0, 0, 0.31819805, 0.31819805, 0.6988, 0.81498571, 0.99349753]
- [0, -0, 0, -0, 0.8444, 1, 0.96835143]
- [0, 0, 0.45, 0, 0.87577, 0.95857143, 1.00128332]
- [-0, -0, -0, -0, 0.8224, 1.05714286, 0.99279368]
Prediction Outputs:
- 0 [None]
- 3 [Heavy Rain]
- 4 [Violent Rain]
- 4 [Violent Rain]

Connections and Adjustments (ESP8266)
// Connections
// NodeMCU ESP-12E (ESP8266) :
// Weather Station
// VV --------------------------- 5V
// D5 --------------------------- RX
// D6 --------------------------- TX
// G --------------------------- GND
I connected the sensor (converter) board to the NodeMCU ESP-12E (ESP8266) development board and fastened them to a plastic box while collecting weather data at my balcony.
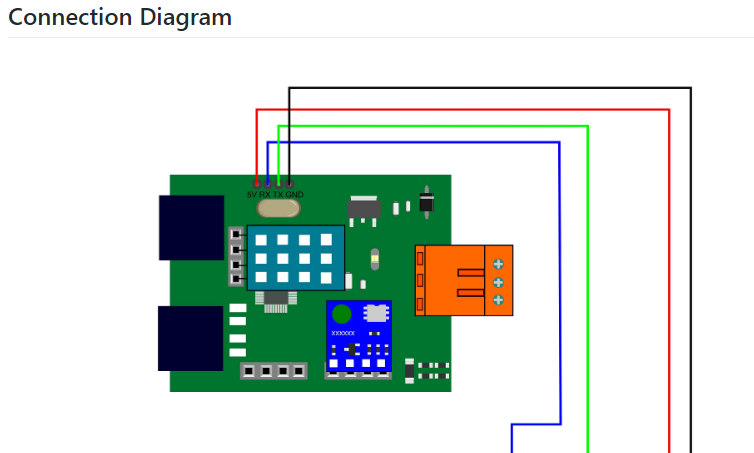
Connections and Adjustments (SIM808)
// Connections
// Arduino Uno:
// SIM808 GPS/GPRS/GSM Shield For Arduino
// D0 --------------------------- RX
// D1 --------------------------- TX
// D12 --------------------------- POWER
// Weather Station
// 5V --------------------------- 5V
// D5 --------------------------- RX
// D6 --------------------------- TX
// GND --------------------------- GND
⭐ Note:D0, D1, D12 pins are occupied by the SIM808 GPS/GPRS/GSM Shield.
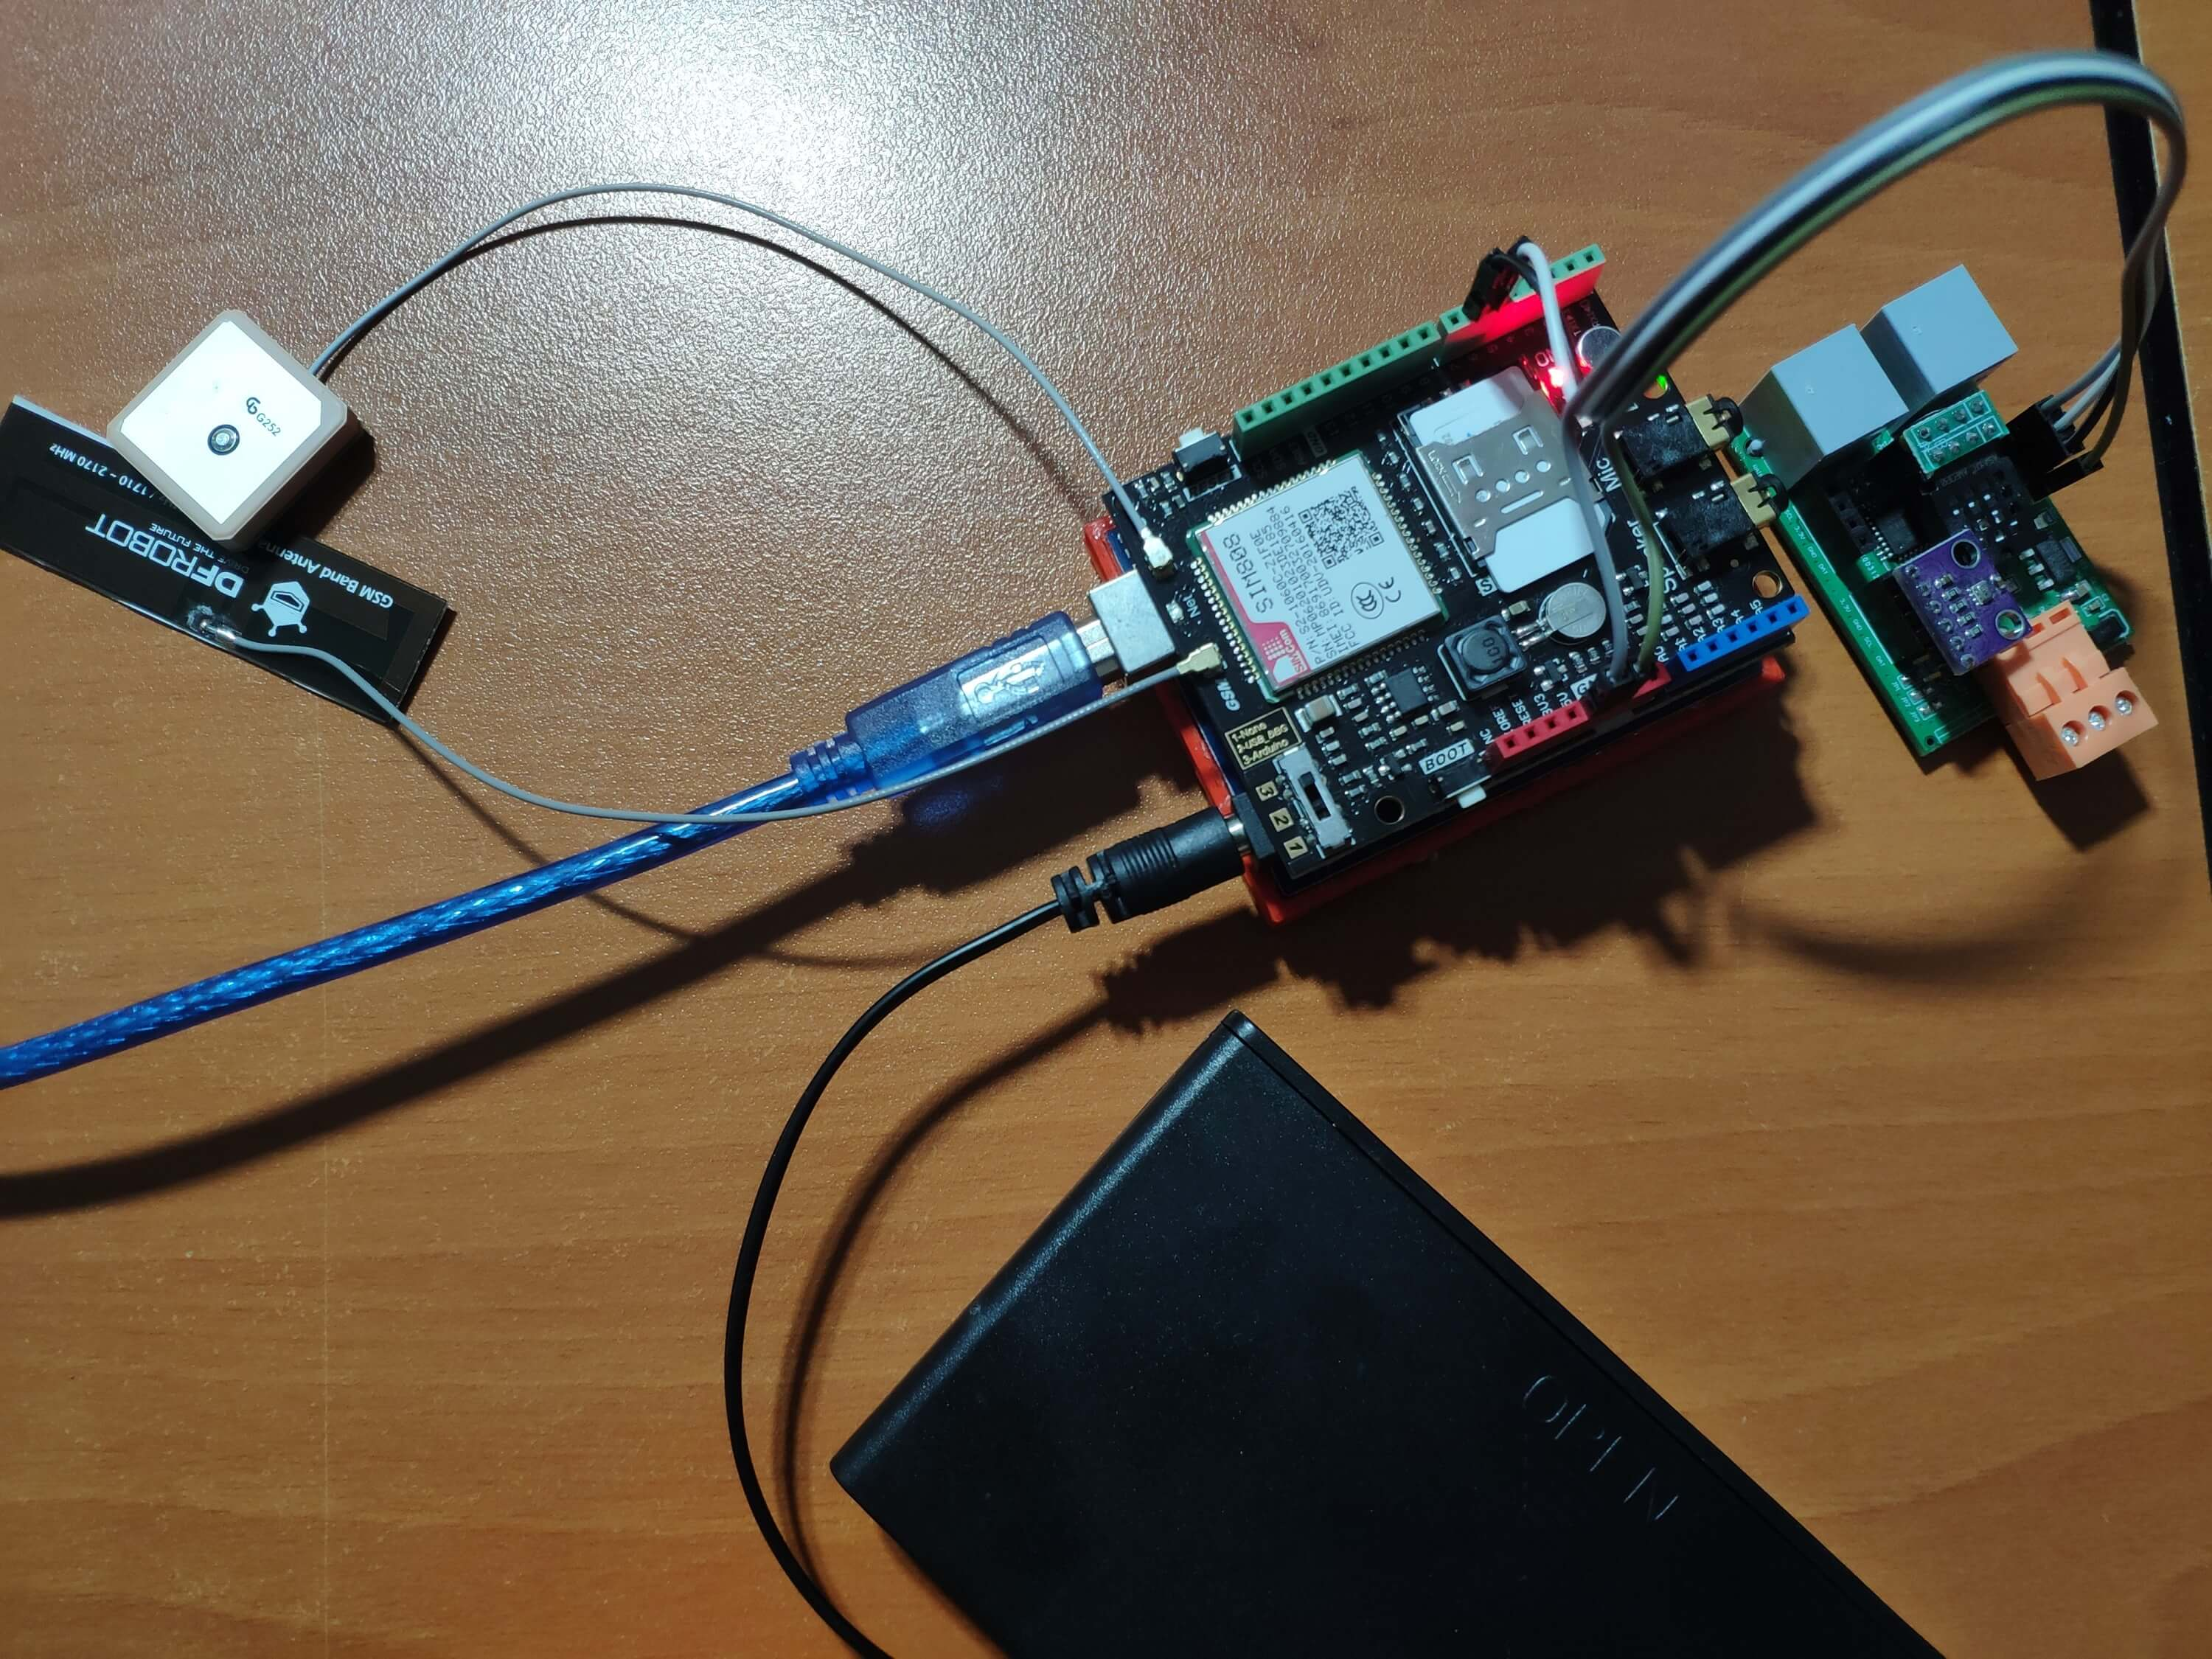
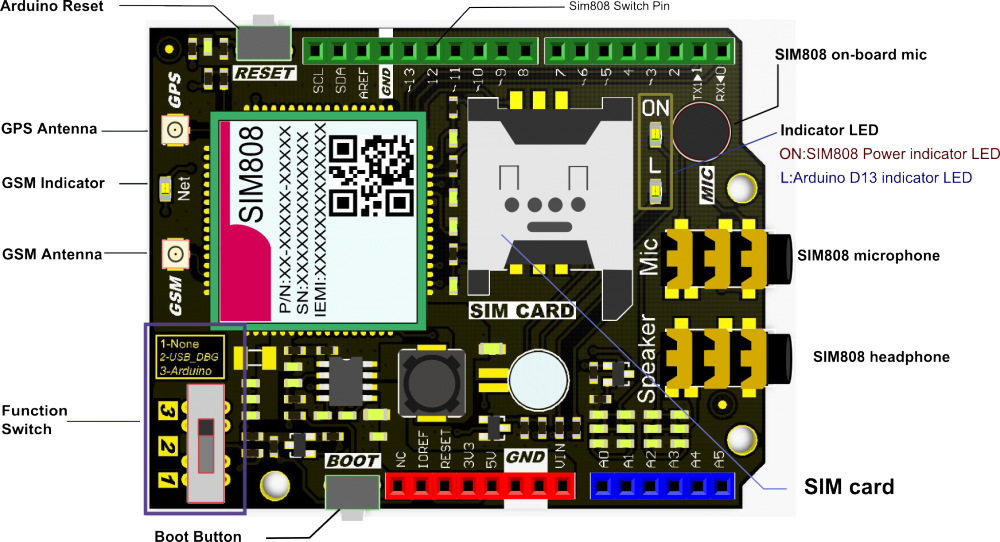
⭐ Connect an external battery (7-23V) for the SIM808 module to work properly.
⭐ Attach the GPS antenna and the GSM antenna to the SIM808 shield.
⭐ Insert a SIM card into the SIM slot on the SIM808 shield.
⭐ Before uploading the code, set the function switch on the shield to None (1).
⭐ Upload the code.
⭐ Then, set the function switch to Arduino (3).
⭐ Press the Boot button on the shield until seeing the Net indicator LED flashing every 1 second and wait for the SIM card to register the network - the Net indicator LED will slowly flash every 3 seconds.
⭐ Click here to get more information about the SIM808 GSM/GPS/GPRS Shield.
After setting up the SIM808 shield with Arduino Uno, I connected the sensor (converter) board to it.
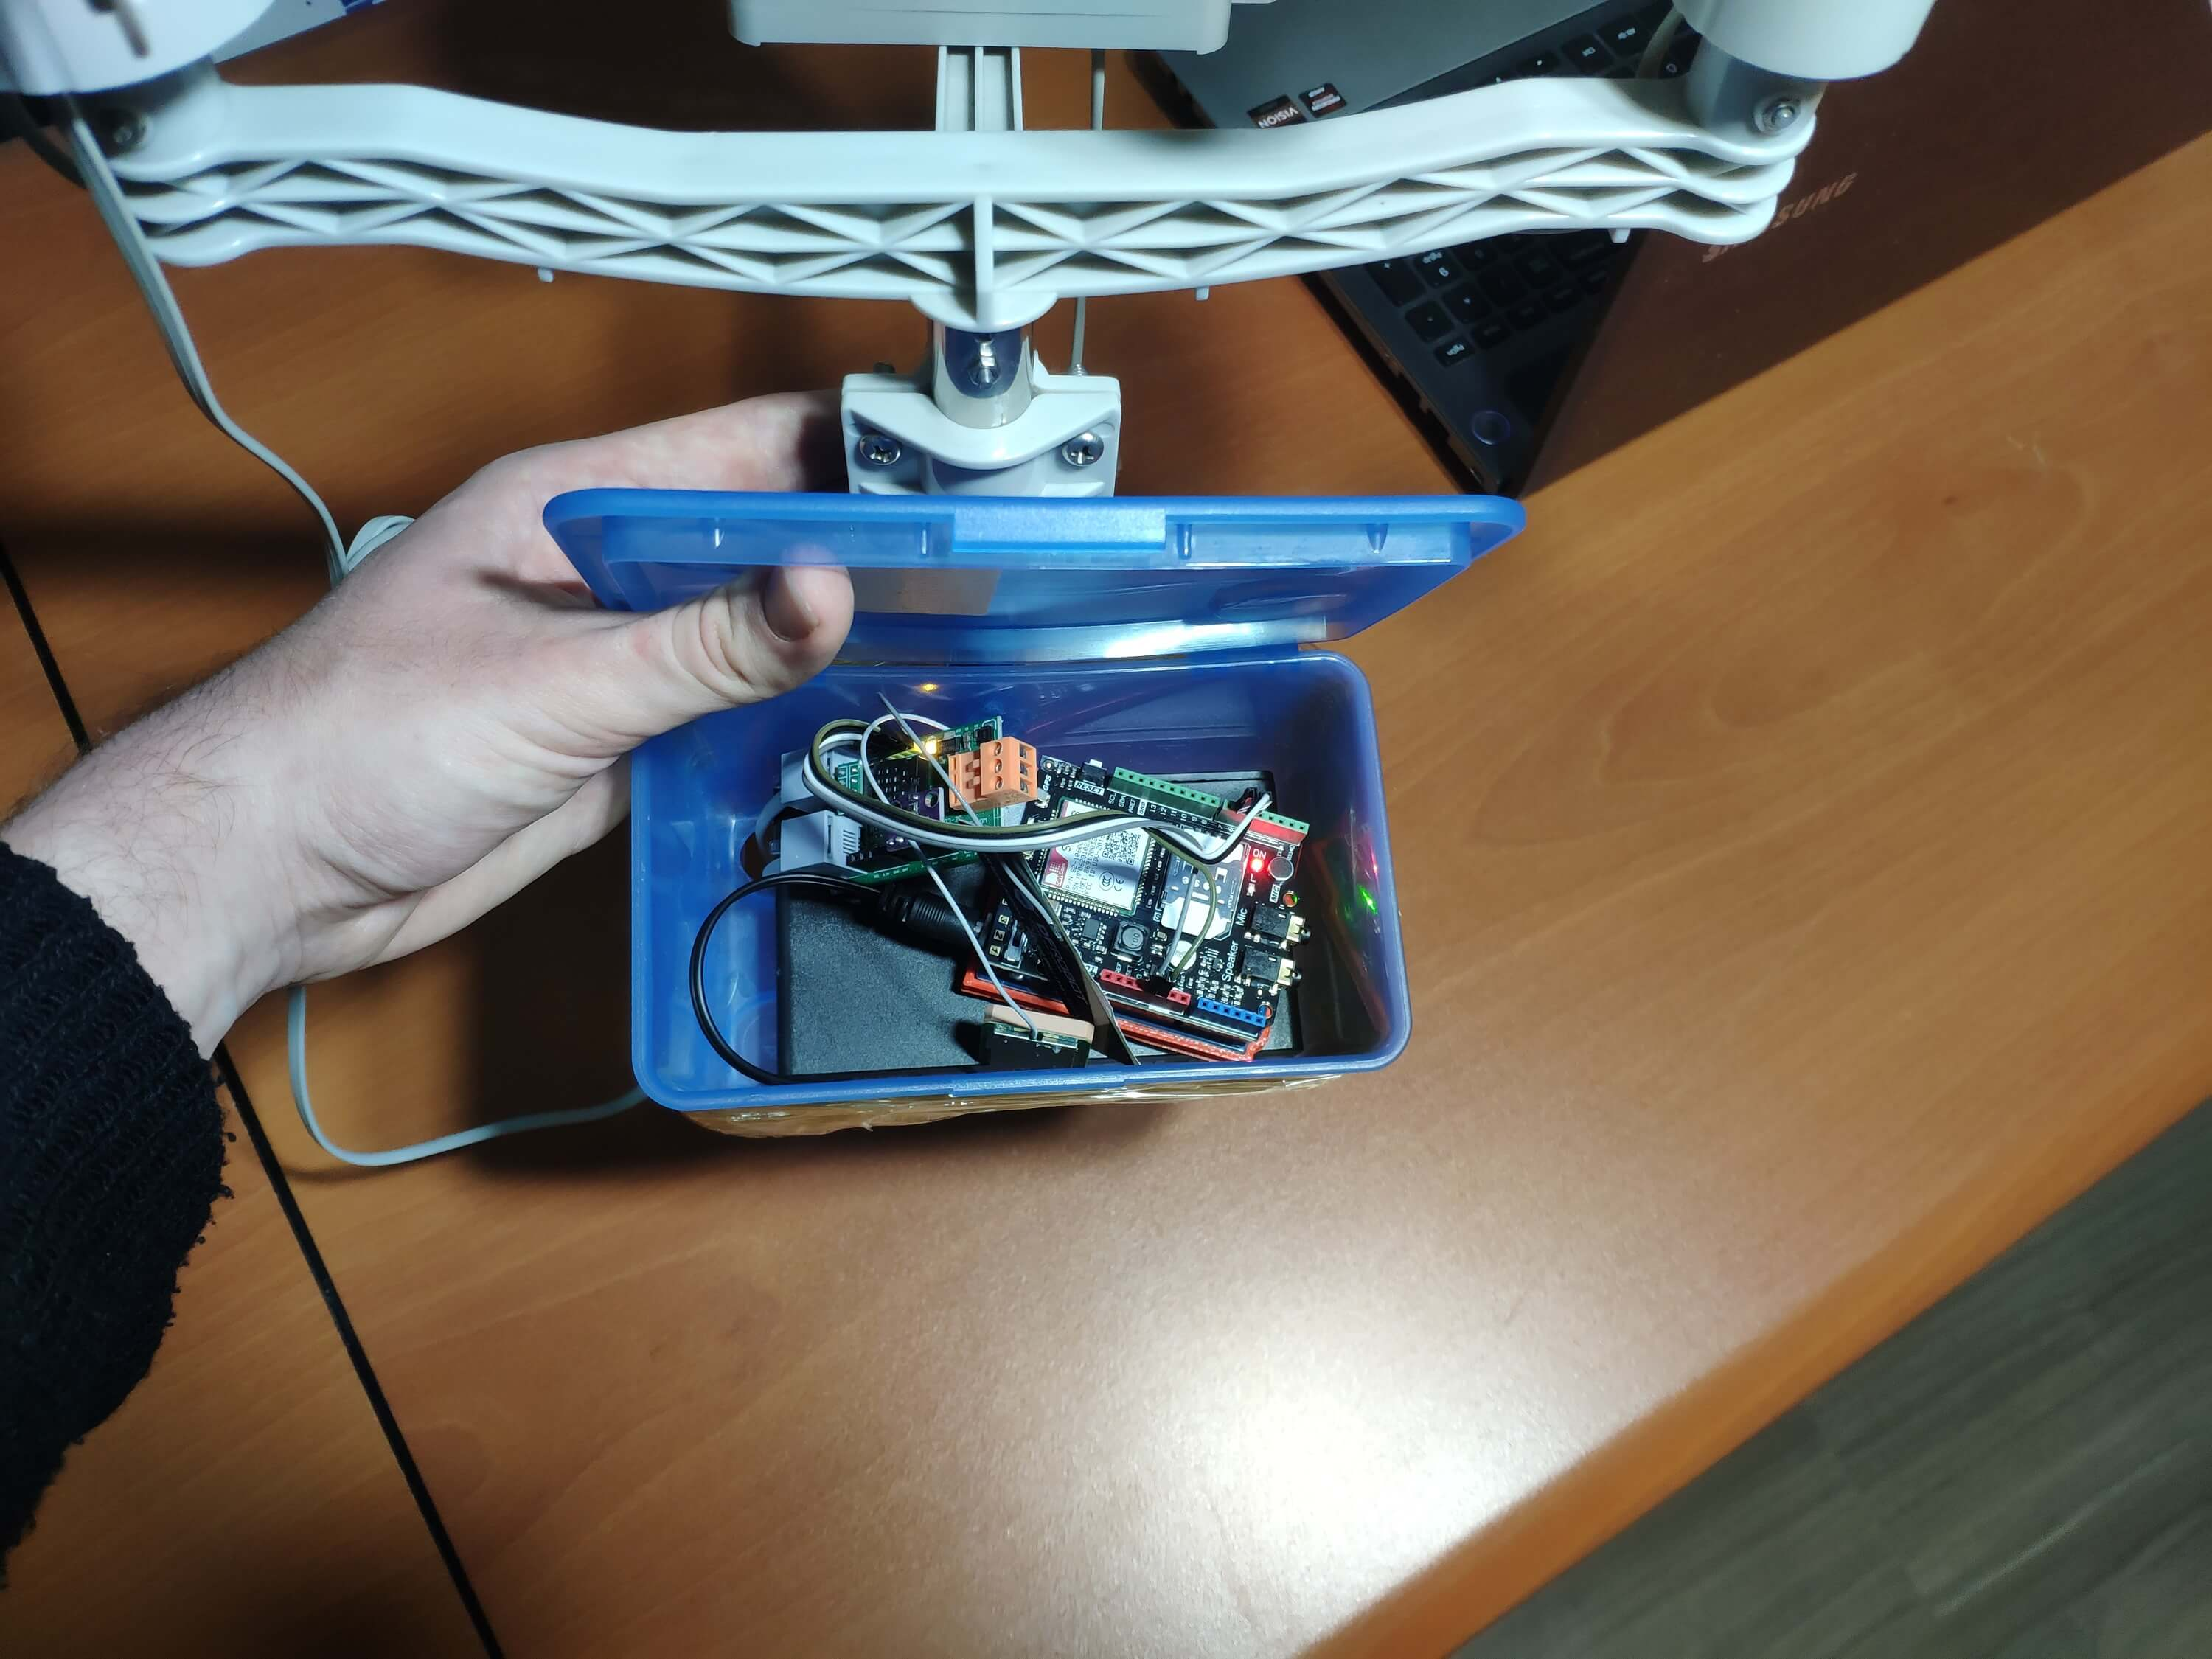
I placed all components into a plastic box to collect weather data outside, even in extreme weather conditions, since the sensor board is not weather-proof.
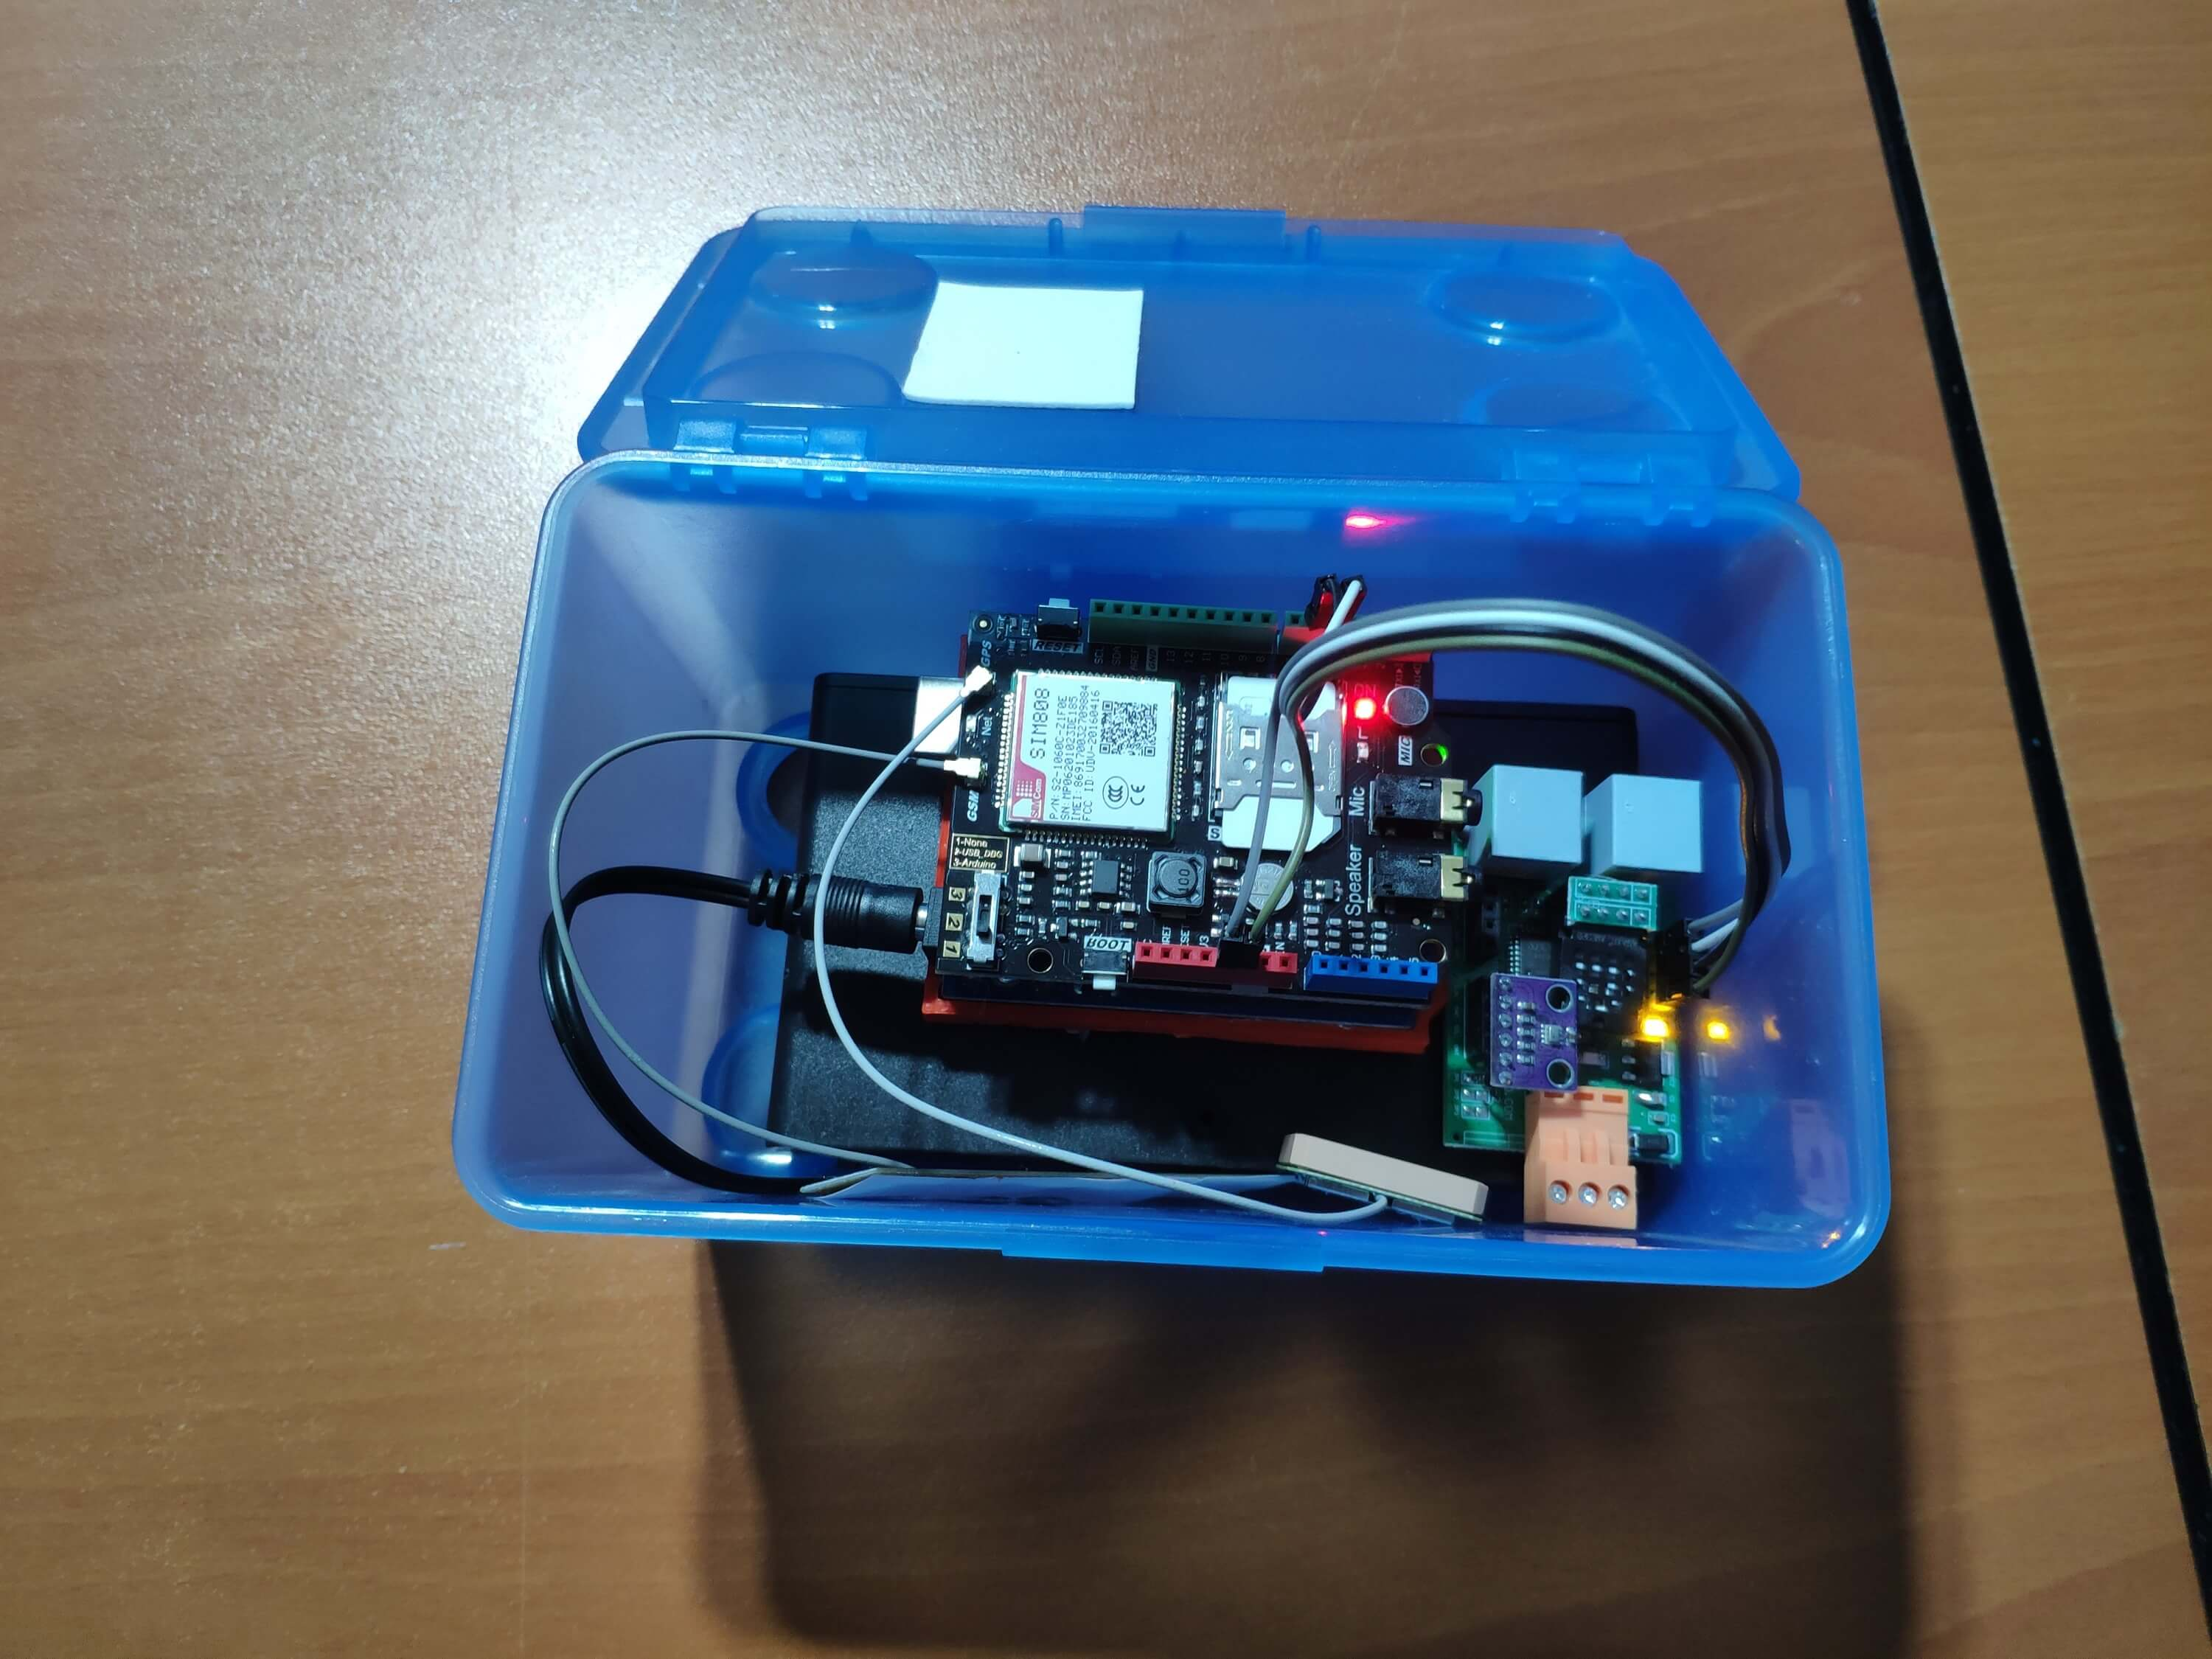
Then, I fastened the plastic box to the weather station.
Videos and Conclusion
After completing coding and assembling the weather station, I collated local weather data for more than three months every five minutes to build my neural network model successfully.
I am still collecting weather data at my balcony and backyard to improve my neural network model and its accuracy :)
Further Discussions
☔ 💧 Since we need local weather data sets to get more accurate predictions on weather phenomena, budget-friendly NN-enabled weather stations like this can be placed on farms and greenhouses to avert the detrimental effects of excessive rainfall on agriculture.
☔ 💧 As early warning systems working with neural networks, we can use them simultaneously to create a swarm of weather stations communicating and feeding each other to forecast rainfall intensity precisely in local areas.
☔ 💧 Also, we can utilize that information for assessing:
- vital water resources,
- agriculture,
- crop productivity,
- ecosystems,
- hydrology.
Ссылки
[1] Extreme weather - heavy rainfall , NIWA, https://niwa.co.nz/natural-hazards/extreme-weather-heavy-rainfall
[2] University of Illinois at Urbana-Champaign, News Bureau. "Excessive rainfall as damaging to corn yield as extreme heat, drought. " ScienceDaily. ScienceDaily, 30 April 2019. www.sciencedaily.com/releases/2019/04/190430121744.htm.
[3] Andrew Culclasure, Using Neural Networks to Provide Local Weather Forecasts , Georgia Southern University, Spring 2013, 29https://digitalcommons.georgiasouthern.edu/cgi/viewcontent.cgi?article=1031&context=etd.
Код
- IoT_weather_station_neural_network.py
- ESP12E_remote_weather_station.ino
- SIM808_remote_weather_station.ino
- index.php (web application)
- account_verification_token.php (web application)
IoT_weather_station_neural_network.pyPython
# IoT Weather Station Predicting Rainfall Intensity w/ TensorFlow# Windows, Linux, or Ubuntu# By Kutluhan Aktar# Collates weather data on Google Sheets and interprets it with a neural network built in TensorFlow to make predictions on the rainfall intensity. # For more information:# https://www.theamplituhedron.com/projects/IoT_Weather_Station_Predicting_Rainfall_Intensity_with_TensorFlowimport tensorflow as tffrom tensorflow import kerasimport matplotlib.pyplot as pltimport numpy as npimport pandas as pd# Create a class to build a neural network after getting, visualizing, and scaling (normalizing) weather data.class Weather_Station:def __init__(self, data):self.df =data self.input =[] self.label =[] # Define class names for different rainfall intensity predictions and values. self.class_names =['None', 'Light Rain', 'Moderate Rain', 'Heavy Rain', 'Violent Rain'] # Create graphics for requested columns. def graphics(self, column_1, column_2, xlabel, ylabel):# Show requested columns from the data set:plt.style.use("dark_background") plt.gcf().canvas.set_window_title('IoT Weather Station') plt.hist2d(self.df[column_1], self.df[column_2]) plt.colorbar() plt.xlabel(xlabel) plt.ylabel(ylabel) plt.title(xlabel) plt.show() # Visualize data before creating and feeding the neural network model. def data_visualization(self):# Inspect requested columns to build a model with appropriately formatted data:self.graphics('WD', '1h_RF', 'Wind Direction (deg)', 'One-Hour Rainfall (mm)') self.graphics('Av_WS', '1h_RF', 'Average Wind Speed (m/s)', 'One-Hour Rainfall (mm)') self.graphics('Mx_WS', '1h_RF', 'Maximum Wind Speed (m/s)', 'One-Hour Rainfall (mm)') self.graphics('24h_RF', '1h_RF', '24-Hour Rainfall (mm)', 'One-Hour Rainfall (mm)') self.graphics('Tem', '1h_RF', 'Temperature (C)', 'One-Hour Rainfall (mm)') self.graphics('Hum', '1h_RF', 'Humidity (%)', 'One-Hour Rainfall (mm)') self.graphics('b_PR', '1h_RF', 'Barometric Pressure (hPA)', 'One-Hour Rainfall (mm)') # Scale (normalize) data depending on the neural network model. def scale_data(self):# Wind Direction and Speed:wv =self.df.pop('Av_WS') max_wv =self.df.pop('Mx_WS') # Convert to radians. wd_rad =self.df.pop('WD')*np.pi / 180 # Calculate the wind x and y components. self.df['scaled_WX'] =wv*np.cos(wd_rad) self.df['scaled_WY'] =wv*np.sin(wd_rad) # Calculate the max wind x and y components. self.df['scaled_max_WX'] =max_wv*np.cos(wd_rad) self.df['scaled_max_WY'] =max_wv*np.sin(wd_rad) # Temperature:tem =self.df.pop('Tem') self.df['scaled_Tem'] =tem / 25 # Humidity:hum =self.df.pop('Hum') self.df['scaled_Hum'] =hum / 70 # Barometric Pressure:bPR =self.df.pop('b_PR') self.df["scaled_bPR"] =bPR / 1013 # 24 Hour Rainfall (Approx.) rain_24 =self.df.pop('24h_RF') self.df['scaled_24h_RF'] =rain_24 / 24 # Define the input and label arrays. def create_input_and_label(self):n =len(self.df) # Create the input array using the scaled variables:for i in range(n):self.input.append(np.array([self.df['scaled_WX'][i], self.df['scaled_WY'][i], self.df['scaled_max_WX'][i], self.df['scaled_max_WY'][i], self.df['scaled_Tem'][i], self.df['scaled_Hum'][i], self.df['scaled_bPR'][i]])) self.input =np.asarray(self.input) # Create the label array using the one-hour and 24-hour rainfall variables:for i in range(n):_class =0 # Evaluate the approximate rainfall rate:approx_RF_rate =(self.df['1h_RF'][i] + self.df['scaled_24h_RF'][i]) * 100 # As labels, assign classes of rainfall intensity according to the approximate rainfall rate (mm):if approx_RF_rate ==0:_class =0 elif approx_RF_rate <2.5:_class =1 elif 2.5 ", self.class_names[np.argmax(prediction[i])]) # Save the model for further usage without training steps:def save_model(self):self.model.save("E:\PYTHON\weather_station.h5") # Run Artificial Neural Network (ANN):def Neural_Network(self, save):self.scale_data() self.create_input_and_label() self.split_data() self.build_and_train_model() if save ==True:self.save_model() # Example Input and Layer:print("\nScaled Input [EXP]:\n") print(self.train_input[0]) print("\nScaled Label [EXP]:\n") print(self.train_label[0]) # Read data (Remote Weather Station.csv):csv_path ="E:\PYTHON\Remote Weather Station.csv"df =pd.read_csv(csv_path)# Define a new class object named 'station':station =Weather_Station(df)# Visualize data:#station.data_visualization()# Artificial Neural Network (ANN):station.Neural_Network(False)# Enter inputs for making predictions:prediction_array =np.array([ [0, 0, 0.31819805, 0.31819805, 0.6988, 0.81498571, 0.99349753], [0, -0, 0, -0, 0.8444, 1, 0.96835143], [0, 0, 0.45, 0, 0.87577, 0.95857143, 1.00128332], [-0, -0, -0, -0, 0.8224, 1.05714286, 0.99279368]])# Prediction Results:station.make_prediction(prediction_array) ESP12E_remote_weather_station.inoArduino
///////////////////////////////////////////// // IoT Weather Station Predicting // // Rainfall Intensity w/ TensorFlow // // ------------------------ // // NodeMCU (ESP-12E) // // by Kutluhan Aktar // // // ///////////////////////////////////////////////// Collates weather data on Google Sheets and interprets it with a neural network built in TensorFlow to make predictions on the rainfall intensity. //// For more information:// https://www.theamplituhedron.com/projects/IoT_Weather_Station_Predicting_Rainfall_Intensity_with_TensorFlow//// Connections// NodeMCU (ESP-12E) :// Weather Station// VV --------------------------- 5V// D5 --------------------------- RX// D6 --------------------------- TX// G --------------------------- GND// Include required libraries:#include#include #include #include #include // Define your WiFi settings.const char *ssid =" ";const char *password =" ";// Define weather station settings:char databuffer[35];double temp;int transferring =0;// Define the serial connection pins - RX and TX.SoftwareSerial Serial_1(D6, D5); // (Rx, Tx)void setup() { // Wait until connected. задержка (1000); // Initiate serial ports:Serial.begin(115200); Serial_1.begin(9600); // It is just for assuring if connection is alive. WiFi.mode(WIFI_OFF); задержка (1000); // This mode allows NodeMCU to connect any WiFi directly. WiFi.mode(WIFI_STA); // Connect NodeMCU to your WiFi. WiFi.begin(ssid, password); Serial.print("\n\n"); Serial.print("Try to connect to WiFi. Please wait! "); Serial.print("\n\n"); // Halt the code until connected to WiFi. в то время как (WiFi.status ()! =WL_CONNECTED) {задержка (500); Serial.print("*"); } // If connection is successful:Serial.print("\n\n"); Serial.print("-------------------------------------"); Serial.print("\n\n"); Serial.print("Connection is successful!"); Serial.print("\n\n"); Serial.print("Connected WiFi SSID :"); Serial.print(ssid); Serial.print("\n\n"); Serial.println("Connected IPAddress :"); Serial.println (WiFi.localIP ()); Serial.print("\n\n");}void loop() { // Get data from the remote weather station:getBuffer(); // Debug the information and create the link:String weather_data ="wd=" + String(WindDirection()) + "&a_ws=" + String(WindSpeedAverage()) + "&m_ws=" + String(WindSpeedMax()) + "&1_rf=" + String(RainfallOneHour()) + "&24_rf=" + String(RainfallOneDay()) + "&tem=" + String(Temperature()) + "&hum=" + String(Humidity()) + "&b_pr=" + String(BarPressure()); String server ="http://192.168.1.24/remote_weather_station/?"; Serial.println("Weather Data => " + weather_data); Serial.println("Buffer => " + String(databuffer)); // Send data packets every 5 minutes to Raspberry Pi (or any server). transferring++; Serial.println("Time => " + String(transferring) + "s / " + String(int(5*60)) + "s\n\n"); if(transferring ==5*60){ // Create the HTTP object to make a request to the server. HTTPClient http; http.begin(server + weather_data); int httpCode =http.GET(); String payload =http.getString(); Serial.println("Data Send...\nHTTP Code => " + String(httpCode) + "\nServer Response => " + payload + "\n\n"); http.end(); transferring =0; } // Wait 1 second... delay(1000);}// WEATHER STATIONvoid getBuffer(){ int index; for (index =0;index <35;index ++){ if(Serial_1.available()){ databuffer[index] =Serial_1.read(); if (databuffer[0] !='c'){ index =-1; } } else{ index --; } }}int transCharToInt(char *_buffer, int _start, int _stop){ int _index; int result =0; int num =_stop - _start + 1; int _temp[num]; for (_index =_start;_index <=_stop;_index ++){ _temp[_index - _start] =_buffer[_index] - '0'; result =10*result + _temp[_index - _start]; } return result;}int WindDirection(){ return transCharToInt(databuffer,1,3); } // Wind Direction (deg)float WindSpeedAverage(){ temp =0.44704 * transCharToInt(databuffer,5,7); return temp; } // Average Air Speed (1 minute)float WindSpeedMax(){ temp =0.44704 * transCharToInt(databuffer,9,11); return temp; } //Max Air Speed (5 minutes)float Temperature(){ temp =(transCharToInt(databuffer,13,15) - 32.00) * 5.00 / 9.00; return temp; } // Temperature ("C")float RainfallOneHour(){ temp =transCharToInt(databuffer,17,19) * 25.40 * 0.01; return temp; } // Rainfall (1 hour)float RainfallOneDay(){ temp =transCharToInt(databuffer,21,23) * 25.40 * 0.01; return temp; } // Rainfall (24 hours)int Humidity(){ return transCharToInt(databuffer,25,26); } // Humidity (%)float BarPressure(){ temp =transCharToInt(databuffer,28,32); return temp / 10.00; } // Barometric Pressure (hPA)
SIM808_remote_weather_station.inoArduino
///////////////////////////////////////////// // IoT Weather Station Predicting // // Rainfall Intensity w/ TensorFlow // // ------------------------ // // Arduino Uno (SIM808) // // by Kutluhan Aktar // // // ///////////////////////////////////////////////// Collates weather data on Google Sheets and interprets it with a neural network built in TensorFlow to make predictions on the rainfall intensity. //// For more information:// https://www.theamplituhedron.com/projects/IoT_Weather_Station_Predicting_Rainfall_Intensity_with_TensorFlow//// Connections// Arduino Uno:// SIM808 GPS/GPRS/GSM Shield For Arduino// D0 --------------------------- RX// D1 --------------------------- TX// D12 --------------------------- POWER // Weather Station// 5V --------------------------- 5V// D5 --------------------------- RX// D6 --------------------------- TX// GND --------------------------- GND// Include required libraries:#include#include // Define the sim808.DFRobot_SIM808 sim808(&Serial);// Define weather station settings:char databuffer[35];double temp;int transferring =0;// Define the serial connection pins - RX and TX.SoftwareSerial Serial_1(6, 5); // (Rx, Tx)void setup() { // Wait until connected. задержка (1000); // Initiate serial ports:Serial.begin(9600); Serial_1.begin(9600); //******** Initialize sim808 module ************* while(!sim808.init()) { delay(1000); Serial.print("Sim808 init error\r\n"); } delay(2000); // Continue if the SIM808 Module is working accurately. Serial.println("Sim808 init success"); delay(5000);}void loop() { // Get data from the remote weather station:getBuffer(); // Debug the information and create the link:String weather_data_1 ="wd=" + String(WindDirection()) + "&a_ws=" + String(WindSpeedAverage()) + "&m_ws=" + String(WindSpeedMax()); String weather_data_2 ="&1_rf=" + String(RainfallOneHour()) + "&24_rf=" + String(RainfallOneDay()) + "&tem=" + String(Temperature()); String weather_data_3 ="&hum=" + String(Humidity()) + "&b_pr=" + String(BarPressure()); Serial.print("Weather Data => " + weather_data_1); Serial.print(weather_data_2); Serial.println(weather_data_3); Serial.println("Buffer => " + String(databuffer)); // Send data packets every 5 minutes to the server. transferring++; Serial.println("Time => " + String(transferring) + "s / " + String(int(5*60)) + "s\n\n"); if(transferring ==5*60){ //*********** Attempt DHCP ******************* while(!sim808.join(F("cmnet"))) { Serial.println("Sim808 join network error!"); задержка (2000); } //************ Successful DHCP **************** delay(5000); Serial.println("Successful DHCP"); //*********** Establish a TCP connection ************ if(!sim808.connect(TCP,"192.168.1.24", 80)) { // Change it with your server. Serial.println("Connection Error"); }else{ Serial.println("Connection OK"); } delay(2000); //*********** Send a GET request ***************** String line ="GET /remote_weather_station/?" + weather_data_1 + weather_data_2 + weather_data_3 + " HTTP/1.0\r\n\r\n"; Serial.println (строка); char buffer[512]; // Convert the line from string to char array to make an HTTP Get Request with the SIM808. char web_hook[110]; String_to_Char(line, 110, web_hook); sim808.send(web_hook, sizeof(web_hook)-1); while (true) { int ret =sim808.recv(buffer, sizeof(buffer)-1); if (ret <=0){ Serial.println("Fetch Over..."); ломать; } // Uncomment to view the response in the serial monitor. /* buffer[ret] ='\0'; Serial.print("Recv:"); Serial.print(ret); Serial.print(" bytes:"); Serial.println(buffer); */ Serial.println("\nData Send"); ломать; } //************* Close TCP or UDP connections ********** sim808.close(); //*** Disconnect wireless connection, Close Moving Scene ******* sim808.disconnect(); // Exit. transferring =0; } // Wait 1 second... delay(1000);}// WEATHER STATIONvoid getBuffer(){ int index; for (index =0;index <35;index ++){ if(Serial_1.available()){ databuffer[index] =Serial_1.read(); if (databuffer[0] !='c'){ index =-1; } } else{ index --; } }}int transCharToInt(char *_buffer, int _start, int _stop){ int _index; int result =0; int num =_stop - _start + 1; int _temp[num]; for (_index =_start;_index <=_stop;_index ++){ _temp[_index - _start] =_buffer[_index] - '0'; result =10*result + _temp[_index - _start]; } return result;}int WindDirection(){ return transCharToInt(databuffer,1,3); } // Wind Direction (deg)float WindSpeedAverage(){ temp =0.44704 * transCharToInt(databuffer,5,7); return temp; } // Average Air Speed (1 minute)float WindSpeedMax(){ temp =0.44704 * transCharToInt(databuffer,9,11); return temp; } //Max Air Speed (5 minutes)float Temperature(){ temp =(transCharToInt(databuffer,13,15) - 32.00) * 5.00 / 9.00; return temp; } // Temperature ("C")float RainfallOneHour(){ temp =transCharToInt(databuffer,17,19) * 25.40 * 0.01; return temp; } // Rainfall (1 hour)float RainfallOneDay(){ temp =transCharToInt(databuffer,21,23) * 25.40 * 0.01; return temp; } // Rainfall (24 hours)int Humidity(){ return transCharToInt(databuffer,25,26); } // Humidity (%)float BarPressure(){ temp =transCharToInt(databuffer,28,32); return temp / 10.00; } // Barometric Pressure (hPA)void String_to_Char(String _String, int _size, char _convert[]){ for(int i=0;i<_size;i++){ _convert[i] =_String[i]; }}
index.php (web application)PHP
 (int)$_GET['wd'], "a_ws" => (float)$_GET['a_ws'], "m_ws" => (float)$_GET['m_ws'], "1_rf" => (float)$_GET['1_rf'], "24_rf" => (float)$_GET['24_rf'], "tem" => (float)$_GET['tem'], "hum" => (int)$_GET['hum'], "b_pr" => (float)$_GET['b_pr'] ];}else{ $variables_from_module =[ "wd" => "err", "a_ws" => "err", "m_ws" => "err", "1_rf" => "err", "24_rf" => "err", "tem" => "err", "hum" => "err", "b_pr" => "err" ];}/** * Returns an authorized API client. * @return Google_Client the authorized client object */function getClient(){ $client =new Google_Client(); $client->setApplicationName('Remote Weather Station'); // Enter your application name. $client->setScopes('https://www.googleapis.com/auth/spreadsheets'); $client->setAuthConfig('credentials.json'); $client->setAccessType('offline'); $client->setPrompt('select_account consent'); // Load previously authorized token from a file, if it exists. // The file token.json stores the user's access and refresh tokens, and is // created automatically when the authorization flow completes for the first // time. $tokenPath ='token.json'; if (file_exists($tokenPath)) { $accessToken =json_decode(file_get_contents($tokenPath), true); $client->setAccessToken($accessToken); print("Token Found!"); } // If there is no previous token or it's expired. if ($client->isAccessTokenExpired()) { // Refresh the token if possible, else fetch a new one. if ($client->getRefreshToken()) { $client->fetchAccessTokenWithRefreshToken($client->getRefreshToken()); } else { // Request authorization from the user. $authUrl =$client->createAuthUrl(); // Do not forget to refresh the page after getting the verification code and entering it to the account_verification_token.php. printf("Open the following link in your browser:

%s

", $authUrl); // <=Comment print 'Do not forget to refresh the page after getting the verification code and entering it to the account_verification_token.php.

Set the verification code in the account_verification_token.php file.'; // <=Comment // Set the verification code to create the token.json. $authCode =trim($GLOBALS['account_verification_token']); // Exchange authorization code for an access token. $accessToken =$client->fetchAccessTokenWithAuthCode($authCode); $client->setAccessToken($accessToken); // Check to see if there was an error and the account_verification_token is entered. if (array_key_exists('error', $accessToken)) { throw new Exception(join(', ', $accessToken)); }else{ print("Successful! Refresh the page."); } } // Save the token to a file. if (!file_exists(dirname($tokenPath))) { mkdir(dirname($tokenPath), 0700, true); } file_put_contents($tokenPath, json_encode($client->getAccessToken())); } return $client;}// Get the API client and construct the service object.$client =getClient();$service =new Google_Service_Sheets($client);// Enter your spreadsheetId:$spreadsheetId ='';// Enter the range (the first row) under which new values will be appended (8 rows):$range ='A1:H1';// Append recent findings from the weather station to the spreadsheet.$values =[ [$variables_from_module["wd"], $variables_from_module["a_ws"], $variables_from_module["m_ws"], $variables_from_module["1_rf"], $variables_from_module["24_rf"], $variables_from_module["tem"], $variables_from_module["hum"], $variables_from_module["b_pr"]]];$body =new Google_Service_Sheets_ValueRange([ 'values' => $values]);$params =[ 'valueInputOption' => "RAW"];// Append if only requested!if(isset($_GET['wd']) &&isset($_GET['a_ws']) &&isset($_GET['m_ws']) &&isset($_GET['1_rf']) &&isset($_GET['24_rf']) &&isset($_GET['tem']) &&isset($_GET['hum']) &&isset($_GET['b_pr'])){ $result =$service->spreadsheets_values->append($spreadsheetId, $range, $body, $params); printf("

%d cells appended.", $result->getUpdates()->getUpdatedCells());}else{ print ("
Missing Data!");}
account_verification_token.php (web application)PHP
"; // Enter the verification code after authorization. ?>
Изготовленные на заказ детали и корпуса
remote_weather_station_OobOCQNPSW.csvСхема
Производственный процесс
- Метеостанция на основе Raspberry Pi
- Метеостанция Raspberry Pi 2
- Метеостанция Raspberry Pi
- Проект IoT 101:потоковая температура с вашего Raspberry Pi
- Удаленный мониторинг погоды с помощью Raspberry Pi
- Присоединяйтесь к IOT со своей метеостанцией - CWOP
- Java ME 8 + Raspberry Pi + Sensors =IoT World (Часть 1)
- Проект Интернета вещей на основе Raspberry PI Подключение датчика DHT11
- Windows 10 IoT Core на Raspberry Pi 2 - данные датчика Adafruit
- Метеостанция V 2.0